
Figures & data
Figure 1. Location map of the October Field and available wells.
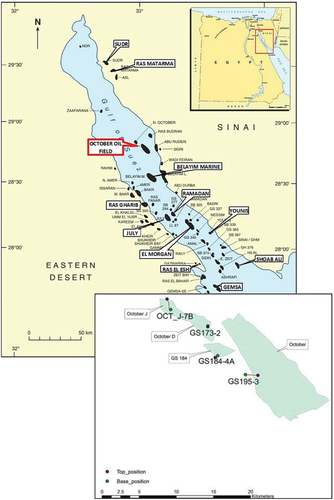
Figure 2. Synoptic models for the evolution of the Gulf of Suez - Red Sea rift system (Bosworth Citation1994).
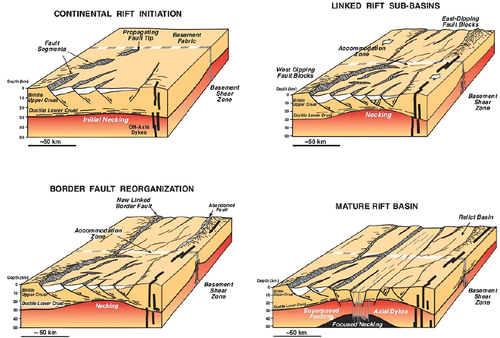
Figure 3. Tectonostratigraphic section for the gulf of Suez (Peijs et al. Citation2012).
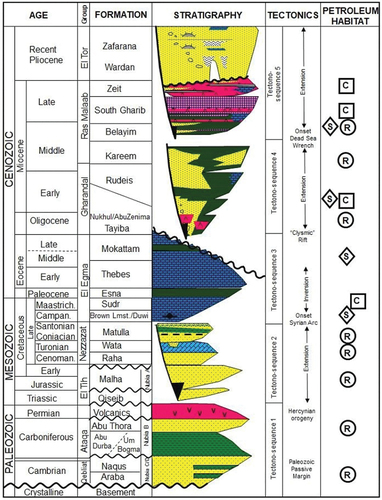
Figure 4. A) interpreted seismic section shows three faults and the three interpreted seismic horizons. B) fault polygons for the top ASL member in the study area.
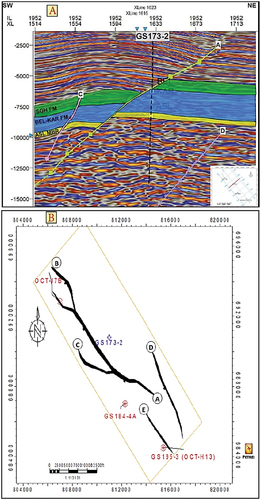
Figure 5. Stratigraphic correlation among wells in the study area for the entire drilled stratigraphic section.
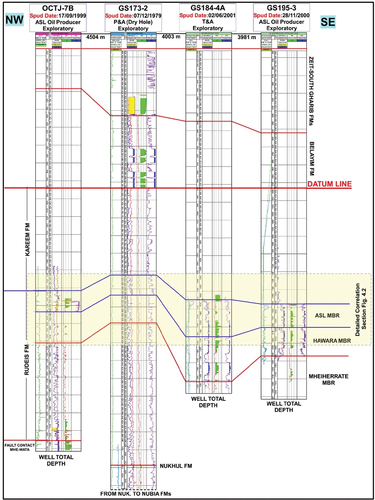
Figure 6. Stratigraphic correlation showing variation in ASL member sandstone thickness.
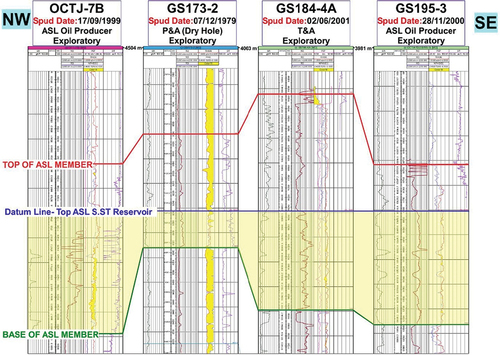
Figure 7. Depth structure contour map for the top of ASL member showing the geologic cross sections illustrated in .
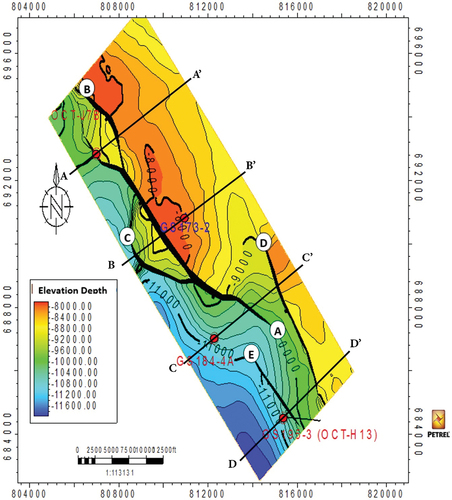
Figure 8. Geologic cross sections (A-A’) NE-SW dip cross section across OCT-J7B well, (B-B’) NE-SW dip cross section across GS173–2 well, (C-C’) NE-SW dip cross section across GS184-4A well, and (D-D’) NE-SW dip cross section across GS195–3 well.
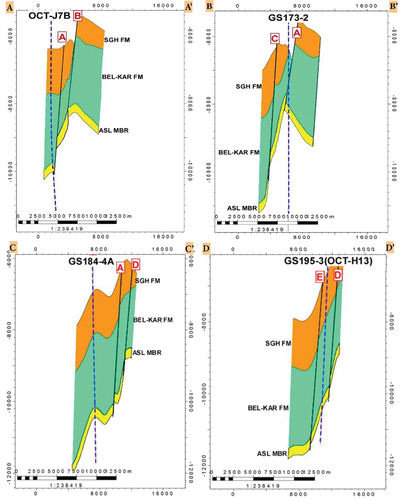
Figure 9. Core chips thin sections photomicrographs in GS184-4A well (a) Sample at depth 11,419.5 ft. shows Q. the corrosive action of calcite cement for QZ grains, C. spary calcite cement, O. siliceous overgrowth cement and G. glauconite. (b) A thin section at a depth of 11,423 ft., shows QZ grains, glauconite, micritic calcite cement, moldic porosity and bryozoa bioclast. (c) A thin section at 11,390 ft. shows QZ grains embedded in micritic cement in polarized light. (d) A thin section at a depth of 11,405 ft. shows foraminifera, traces QZ, glauconite, micritic calcite cement, and polarized light. (e) Sample at depth 11,353 ft. shows fracture-filled by pyrite, A. siliceous overgrowth cement, polarized light. (f) Photomicrograph at a depth of 11,372 ft. shows quartz grains with calcite cement, polarized and crossed polarized light. (g) Photomicrograph at a depth of 11,335 ft. shows siliceous overgrowth cement crossed polarized. (h) A thin section at a depth of 11,341 ft. shows well-sorted sandstone with intergranular porosity, crossed polarized: magnification 40X.
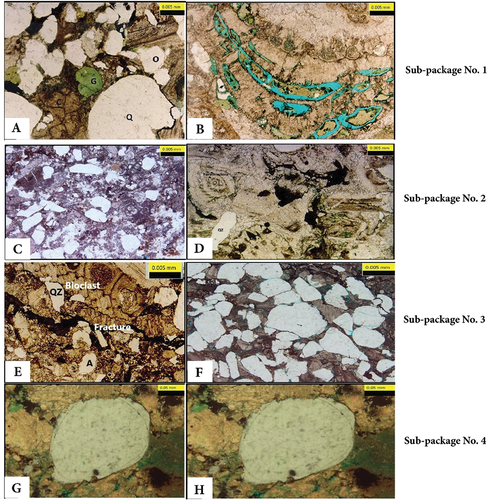
Figure 10. Schematic image of ASL reservoir built on typical submarine fans (after Prélat et al. (Citation2009), Sømme et al. (Citation2009), Ferguson et al. (Citation2020)).
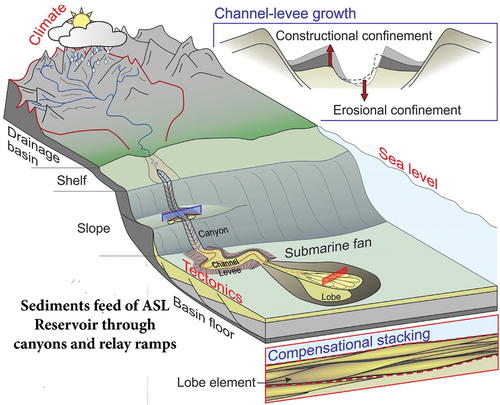
Figure 11. Core chips thin sections photomicrographs in GS184-4A well, (A) Highlight moldic spary calcite cementation at depth 11,330 ft., polarized. (B) Photomicrograph highlights compaction at a depth of 11,333 ft., polarized light. (C) Thin section highlights moldic porosity due to the leaching of skeletal grains at a depth of 11,423 ft., polarized light. (D) Thin section shows the dissolution of skeletal grain and polarized light. (E) Section highlights fractures at a depth of 11,333 ft., polarized light, and (F) Thin sections photomicrograph at a depth of 11,363 ft., highlight selective dolomitization which enhanced porosity, polarized light: magnification 200X.
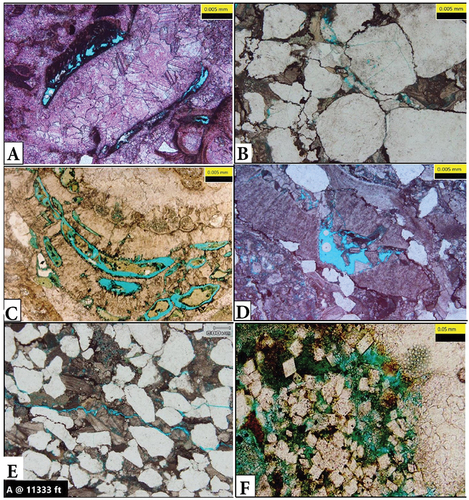
Figure 12. MID lithology crossplot for ASL member in (A) OCT-J7B well, (B) GS173–2 well, (C) GS184-4A well, and (D) GS195–3 well.
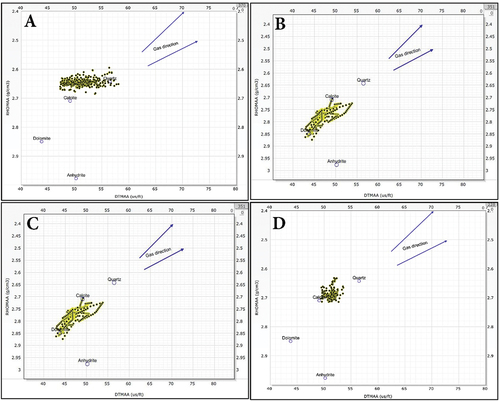
Table 1. ASL reservoir summary for the study area.
Figure 13. The qualitative relationship between core-measured parameters (helium porosity, horizontal permeability, water, and hydrocarbon saturations) and the corresponding log-derived parameters.
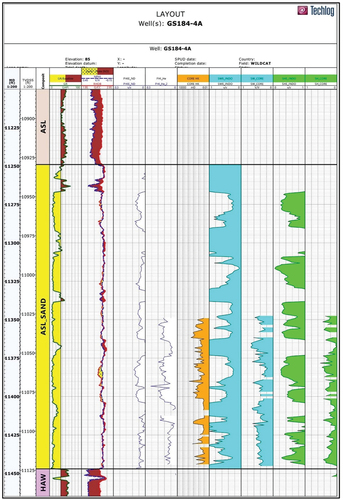
Figure 14. Core helium porosity and log-derived effective porosity relationship.
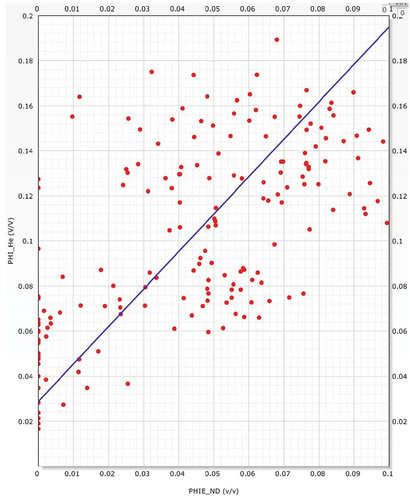
Figure 15. Composite petrophysical parameters maps of ASL Reservoir.
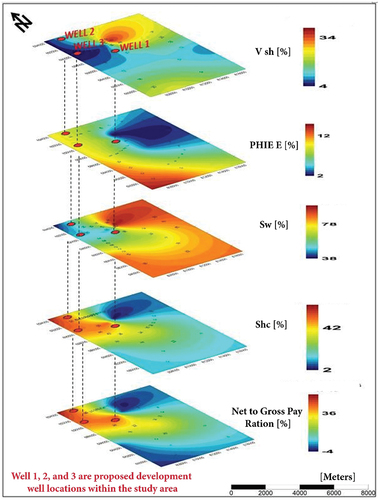
Table 2. Proposed new development wells in the area of study.