
Figures & data
Figure 1. Geological reconstruction map of West African and NE Brazil Pan-African domains (Castaing et al. Citation1993). Cameroon borders are depicted as dashed lines and the aeromagnetic data used for comparison with the global geomagnetic models are represented by the red polygon. CCSZ: Central Cameroon Shear Zone; SF: Sanaga Fault; TBSZ: Tchollire Banyo shear zone; Pa: Patos shear zone; Pe: Pernambuco shear zone.
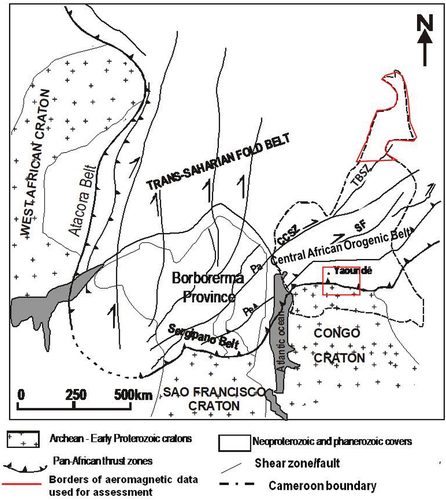
Table 1. Summary of the characteristics and performance metrics of the global geomagnetic models used in the study.
Figure 2. Total magnetic intensity maps of Cameroon extracted from geomagnetic models with the 4 profiles used for comparison superimposed on each model: (a) EMAG2v2; (b) EMAG2V3; (c) WDMAM v2.0. We can observe similarities in the extension and intensity of the magnetic signal between both EMAG2v2 and WDMAM v2.0 models.
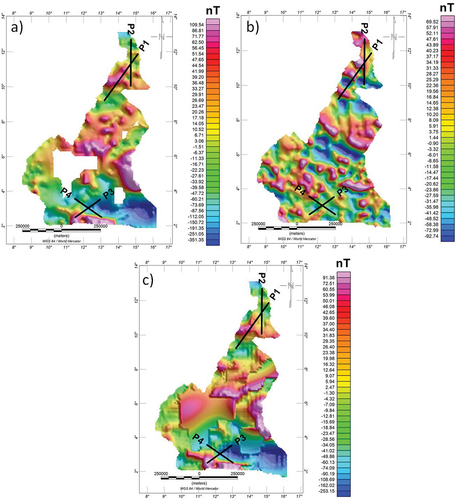
Figure 3. Aeromagnetic anomaly maps of: (a) Far North Cameroon with the two selected profiles (P1 and P2) superimposed on it; (b) part of the South region of Cameroun with the two selected profiles (P3 and P4) superimposed on it.
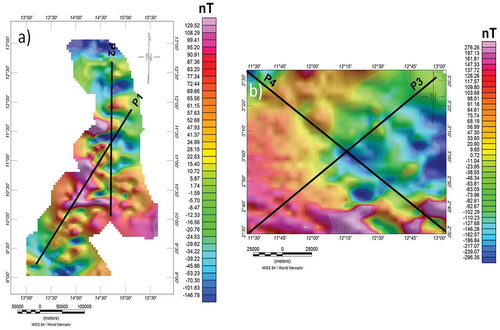
Table 2. Pearson’s correlation coefficient variation between EMAG2v3, EMAG2v2, WDMAM v2.0, and aeromagnetic data upward-continued at several heights for each profile.
Table 3. Statistics for the amplitude difference and standard deviation between global geomagnetic models and aeromagnetic data for each profile. Up=Upward-continuation; TMI=Total Magnetic Intensity; Std.Dev= Standard deviation.
Figure 4. Power density curves of both global geomagnetic models and aeromagnetic data of: (a) Far North Cameroon and (b) South Cameroon as depicted in .
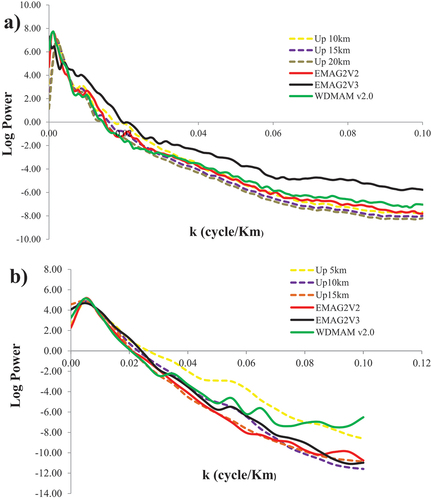
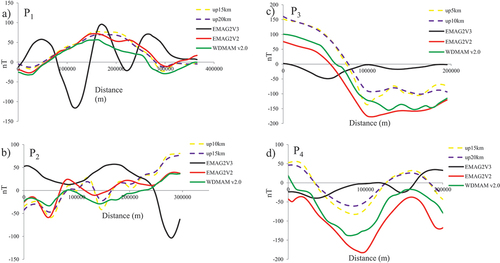
Figure 5. Comparison of EMAG2v2, EMAG2v3, WDMAM v2.0, and aeromagnetic data (extracted in Figs. 2 and 3) for each profile: (a) profile 1, a better match is observed between WDMAM v2.0, EMAG2v2 and 15-km, 20-km upward-continued airborne magnetic data respectively; (b) profile 2, a good correlation is found between WDMAM v2.0, EMAG2v2 and 10-km, 15-km upward-continued airborne magnetic data comprehensively; (c) profile 3, a strong correlation is noticeable between WDMAM v2.0, EMAG2v2 and 5-km, 10-km upward-continued airborne magnetic data respectively; (d) profile 4, a strong match is depicted between WDMAM v2.0, EMAG2v2 and 15-km, 20-km upward-continued airborne magnetic data comprehensively.
Data availability statement
The data that support the findings of this study are available on request from the corresponding author. The aeromagnetic data are not publicly available due to some ethical restrictions.