
Figures & data
Table 1. Liver/peripheral blood (L/P) ratio data, and theoretical postmortem redistribution factor (Ft): alphabetical listing for 44 drugs.
Table 2. Case examples: postmortem redistribution factor (F) compared to theoretical postmortem redistribution factor (Ft).
Figure 1. Case examples: postmortem redistribution factor (F) compared to theoretical postmortem redistribution factor (Ft).
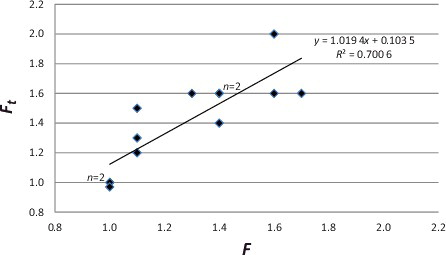
Table 3. Theoretical postmortem redistribution factor (Ft): listed in increasing propensity for postmortem redistribution (PMR).