
Figures & data
Figure 1. The smoking machine used in this study.
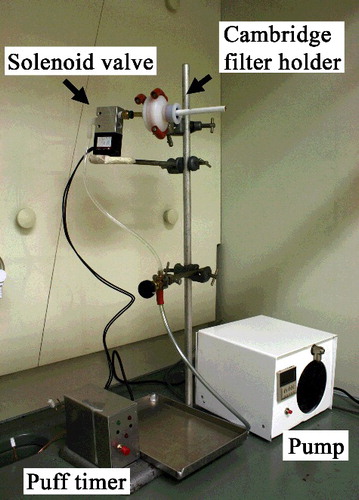
Table 1. Gas chromatography/mass spectrometry (GC/MS) parameters for the analysis of Δ9THC.
Table 2. Gas chromatography/mass spectrometry (GC/MS) parameters for the analysis of cannabis smoke extracts.
Table 3. The Δ9THC content (CTHC), total particulate matter (TPM), delivery efficiency and mass of terpenoid data for the cannabis samples in this study.
Figure 2. An example of a total ion chromatogram (TIC) of the total particulate matter (TPM) collected from five cannabis joints of a single cannabis sample (12.2% CTHC).
Figure 3. Scatter diagram of the estimated total mass of terpenoids in the TPM vs. the Δ9THC content (CTHC).
Table 4. Terpenoids identified and their estimated mass in the cannabis smoke TPM extracts, presented as µg/g of cannabis smoked (Rep 1, Rep 2).