Figures & data
Figure 1. (A) FTIR averaged spectra of semen stains at different time points in the range of 1 800–900 cm−1. (B) The spectra of second derivative transformation at different time points in the same range.
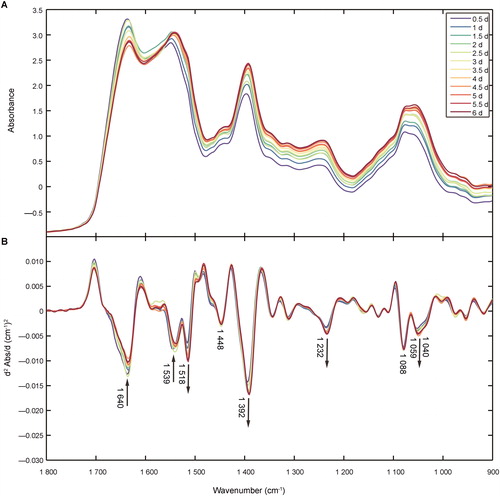
Table 1. Major Fourier transform infrared spectroscopy (FTIR) peak component assignment of semen stain.
Figure 2. Raw spectra from semen stains (grey lines) and eluent from semen stains on tissues (orange line) and fabric made of regenerated cellulose fibres (blue line).
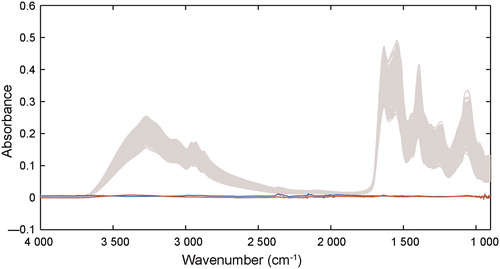
Figure 3. Principle component analysis result of different samples of semen stains on three substrates over 6 d. Complicated overlap indicates small variation between different substrates. PC: Principle component.
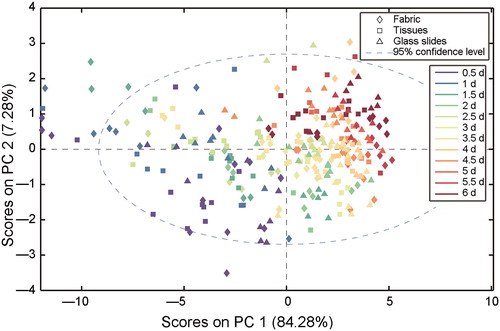
Figure 4. Results from the internal validation and external validation sets by (A) partial least squares regression (PLSR) models and (B) second derivative transformation by PLSR models in 0.5–6 d period. The grey dashed lines are the reference lines corresponding to the perfect external validation.
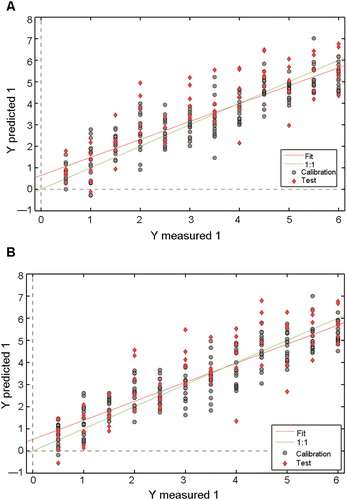
Figure 5. Loading plot of latent variable (LV) 1 in the partial least squares regression (PLSR) model of second derivative transformation. The gray dashed line is the reference line corresponding to the perfect external validation.
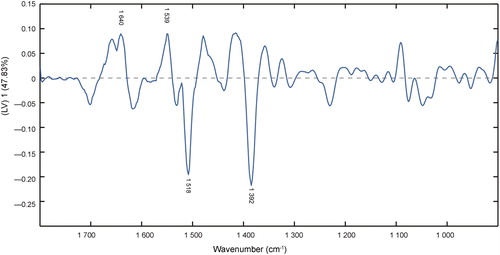
Table 2. Comparison the partial least squares regression (PLSR) models based on absorbance and second derivative spectra.
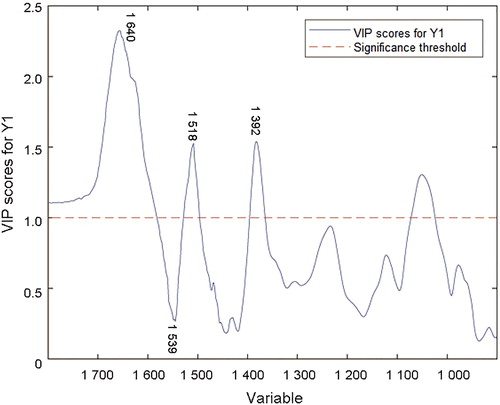
Figure 6. Variable importance in projection (VIP) scores in the partial least squares regression (PLSR) model of second derivative transformation.