Figures & data
Figure 1. In the dental record, tooth 45 (lower right second premolar, shaded green in the odontogram and treatment notes) is recorded as having been extracted, but it is tooth 46 (shaded in pink) that has been crossed out. We cannot resolve this problem without further information or images such as X-rays. (Image courtesy Health Support Queensland Forensic and Scientific Services (HSQ FSS) and the Queensland State Coroner, with permission).
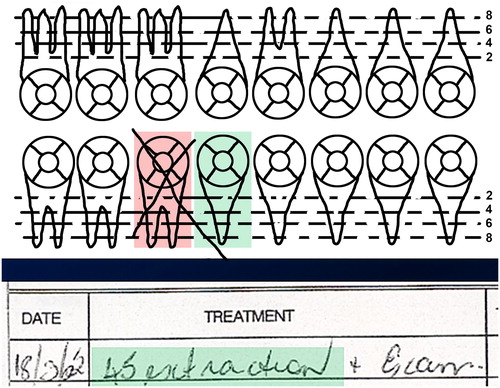
Figure 2. X-ray image comparison. The bright white areas in the tooth crowns represent the unique shapes of metal amalgam fillings. The chances of getting such a level of similarity between the teeth, filling shapes and bone levels in two individuals chosen at random would be exceedingly small, so it is reasonable to state that these images originate from the same person. (Image courtesy Health Support Queensland Forensic and Scientific Services (HSQ FSS) and the Queensland State Coroner, with permission).
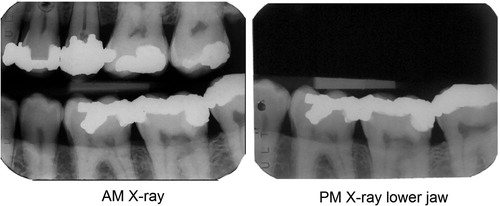
Figure 3. X-ray superimposition. Superimposing the images demonstrates the similarities between the dental features in an intuitive way. (Image courtesy Health Support Queensland Forensic and Scientific Services (HSQ FSS) and the Queensland State Coroner, with permission).
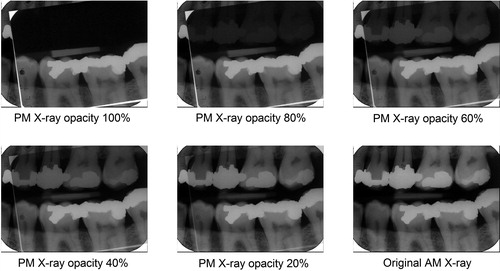
Figure 4. Subtraction imaging. The postmortem (PM) image is superimposed on the antemortem (AM) image and turned into a negative. When its opacity is reduced, the AM image becomes progressively more visible until all the overlying negative and underlying positive colours cancel to resolve to grey wherever the images are similar. Changed features now become clear. The suggestion of a white margin around the amalgam fillings indicates a slight mismatch in the sensor or beam alignment or both between the two images, demonstrating that they are the same object. (Image courtesy Health Support Queensland Forensic and Scientific Services (HSQ FSS) and the Queensland State Coroner, with permission).
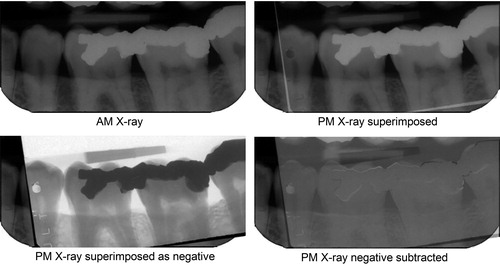
Figure 5. Comparison between antemortem (AM) orthopantomogram (OPG) X-ray of a missing person and multiplanar reconstructions (MPR) of CT data of the upper and lower jaws of a victim. Corresponding features are indicated by yellow arrows. The red arrow in the upper jaw indicates a tooth that was extracted before death and the orange arrow in the lower jaw indicates a filling that was replaced. Both are accounted for in the written dental record. (Image courtesy Health Support Queensland Forensic and Scientific Services (HSQ FSS) and the Queensland State Coroner, with permission).
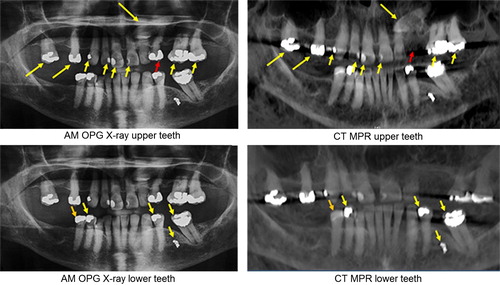
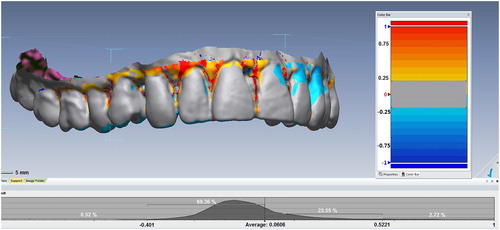
Figure 6. Three-dimensional (3 D) superimposition. The postmortem (PM) surface is superimposed on the antemortem (AM) surface. In this case, scans were secured by a low-resolution medical CT scanner with an approximately 0.3 slice thickness. Surfaces matching within a region of 0.5 mm are coloured grey, while those that fall outside this range (mainly soft tissues) are coloured according to the degree of mismatch. With modern intraoral scanners, the resolution and scan precision are much higher, so the width of the grey zone can be reduced to a level measured in tens of microns, providing excellent individuation. (Image courtesy Ms Donna MacGregor and Mr Mark Barry, with permission).