Figures & data
Figure 1. The area enclosed by red thin lines shows how the overlapping Thiessen (black asterisks), Voronoi (blue lines), and Delaunay (red thick lines) models lead to the circumscription of a specific area.
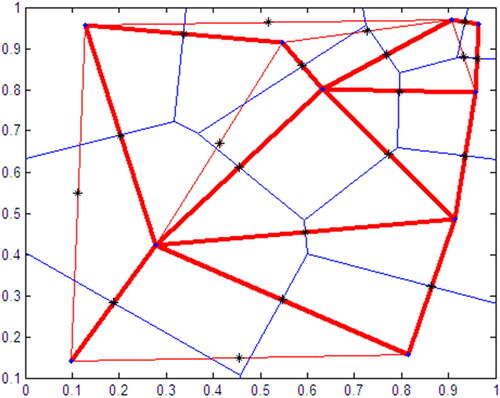
Figure 2. The result of the geographic profiling investigation in Case 1. The yellow dot indicates the centre of gravity of the search area of r = 700 m. The person was found lifeless at the point indicated by the red dot.
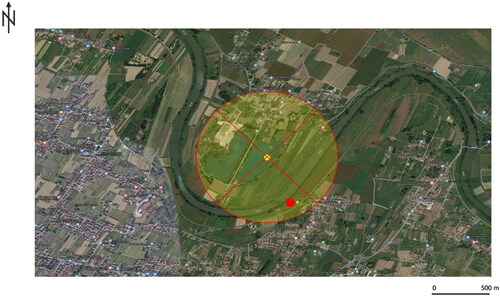
Figure 3. The result of the geographic profiling investigation in Case 2. The area enclosed by red lines indicates the region of interest for searching the missing person, found lifeless at the point indicated by the bright red dot.
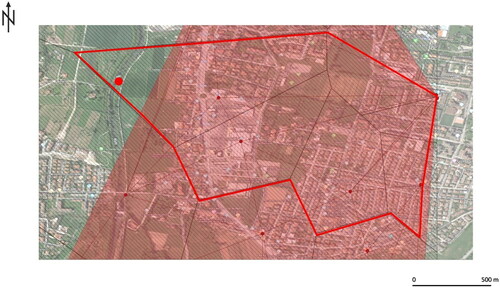
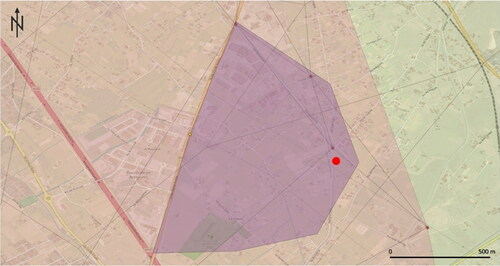
Figure 4. The result of the geographic profiling investigation in Case 3. The purple area indicates the region of interest for searching the missing person, found lifeless at the point indicated by the red dot.