Figures & data
Figure 1. Ankle model of the Total Human Model of Safety 4.0 (THUMS 4.0).
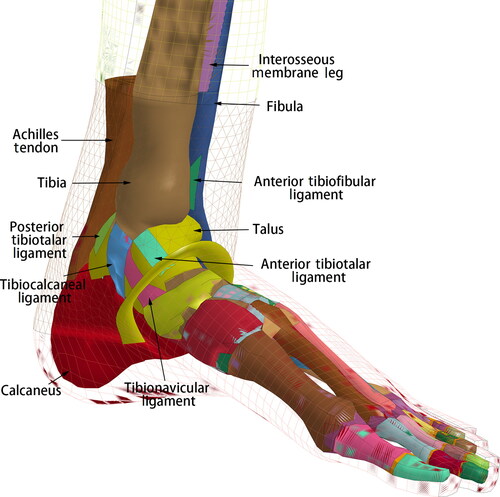
Table 1. Simulation loading condition of ankle injury caused by falling.
Table 2. Simulation loading conditions of ankle injury caused by impact.
Figure 2. (A) The effective plastic strain of the tibia and talus increases as the height of falling increases, which differs from the natural posture. (B) The distal tibia and talus endure smaller effective plastic strains in inversion posture which may cause less severe injury than eversion posture.
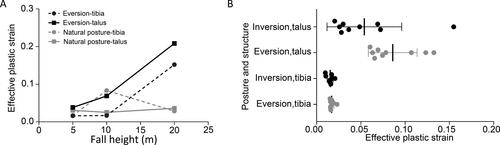
Table 3. Peak strain of main structures when ankle with natural posture after landing.
Figure 3. Antapical view of the ankle articular surface (with dorsiflexion of 20° falling from 5 m).
The lateral anterior part of the distal tibia fractured first where the effective plastic strain initially increased when ankle shows dorsiflexion after landing.
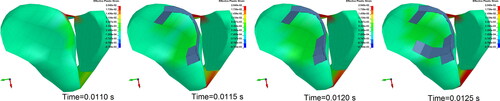
Figure 4. Maximum principal strain contours of the ligaments (ankle with dorsiflexion of 30° falling from 5 m). (A) Anterior aspect. The maximum principal stress of the anterior talofibular ligament and anterior tibiotalar ligament appears an obvious increase, indicating a high injury risk. (B) Posterior aspect. The maximum principal stress of posterior talofibular ligament and posterior ligament appears an obvious increase, indicating a high injury risk. (Each column is at the same time point).
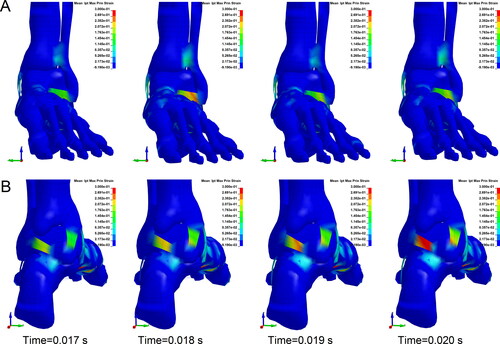
Table 4. Fracture sites of ankle with planter flexion angle after landing.
Table 5. Injury patterns of ankle with composite postures after landing.
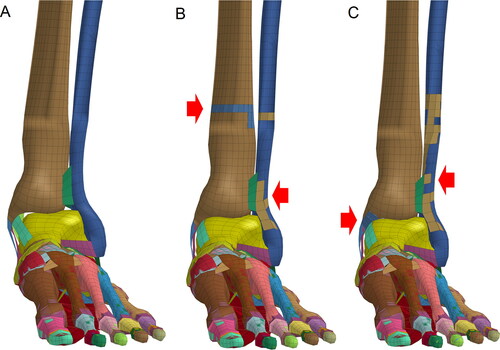
Figure 5. Ankle fractures formed by lateral-medial (L-M) impacts on the ankle. (A) Impacts at lower speeds (10 or 15 m/s) cause lateral condyle fractures. (B) Impacts at higher speeds (≥20 m/s) cause lateral condyle fractures and avulsion fractures of the medial condyle. (Red arrow indicates the fracture site where elements are coloured differently from the surrounding area).
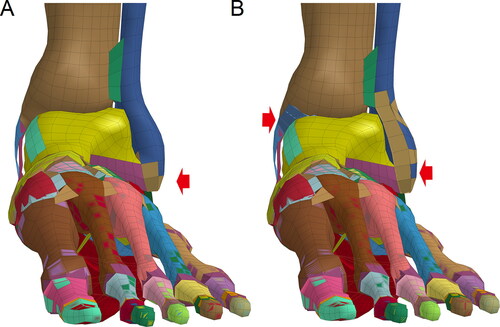
Figure 6. Ankle fractures formed by posterior-anterior (P-A) impacts on the ankle. (A) Impact at a speed of 10 m/s caused lateral condyle fracture and avulsion fractures of the medial condyle. (B) Impact at a speed of 15 m/s did not cause fractures. (C) Impact at a speed of 20 m/s caused tibia and fibula fractures at the impact points. (Red arrow indicates the fracture site where elements are colored differently from the surrounding area).
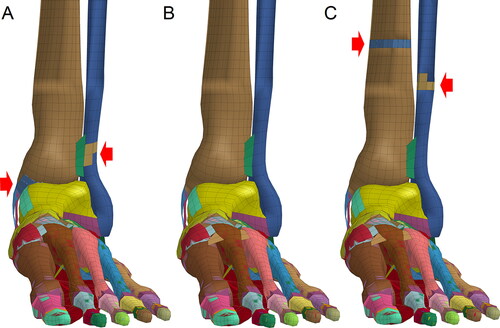
Table 6. Peak strain of main structure of impacted (anterior-posterior, A-P) ankle.
Figure 7. Stress contours of ligaments and tibia (anterior-posterior, A-P impact on lower leg). (A) Contour of lateral ligaments’ maximum principal stress. Maximum principal stress increased in the talofibular ligament. (B) Contour of medial ligaments’ maximum principal stress. Maximum principal stress of the anterior deltoid ligament obviously increased, indicating a high risk of injury. (C) Contour of effective stress in the distal tibia and fibula. Effective stress of the medial part of the distal tibia, where pulling by anterior deltoid ligament increased and caused avulsion fracture. (Each column is at the same time point).
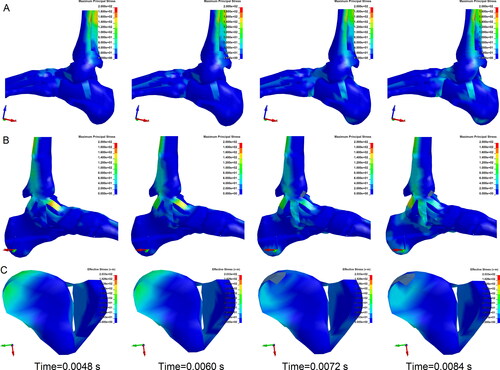
Figure 8. Strains of the main structures of ankle caused by anterior-posterior (A-P) impacts on points with different heights. (A) The maximal bone effective plastic strain caused by A-P impacts on the lower leg (height of 125 mm). (B) The peak ligaments’ maximum principal strain was also caused by impacts on the lower leg, indicating that A-P impacts on the lower leg may result in more serious injuries of both bones and ligaments than A-P impacts on other sites.
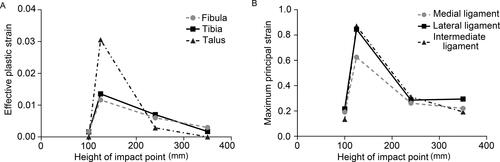
Figure 9. Ankle fractures caused by lateral-medial (L-M) impacts on the lower leg. (A) Impact at a speed of 10 m/s did not cause ankle fractures. (B) Impact at 15 m/s caused fractures of the lateral condyle and impact site. (C) Impact at 20 m/s caused fractures of the lower fibula and avulsion fractures of the medial condyle. (Red arrow indicates the fracture site where elements are coloured differently from the surrounding area).