
Figures & data
Table 1. Age and sex distribution of training dataset and testing dataset from the study population.
Table 2. The mean CA, mean DA, MD and MAD of both sexes and all age groups for Demirjian method based on training dataset.
Table 3. The mean CA, mean DA, MD and MAD of both sexes and all age groups for Nolla method based on training dataset.
Figure 1. The comparison of mean absolute differences (MAD) for all age groups of males (A) and females (B) in testing dataset using Demirjian, Nolla and new adapted methods.
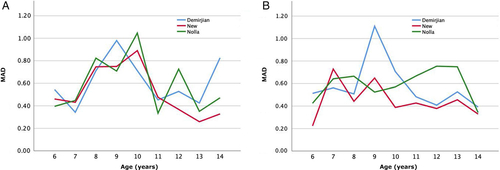
Table 4. The mean CA, mean DA, MD and MAD for males, females and total samples for Demirjian, Nolla and new method based on testing dataset.