Figures & data
Figure 1. Rarefaction curves of observed species number clustered at 97% sequence identity across all samples. Sample named to refer to samples as described in .
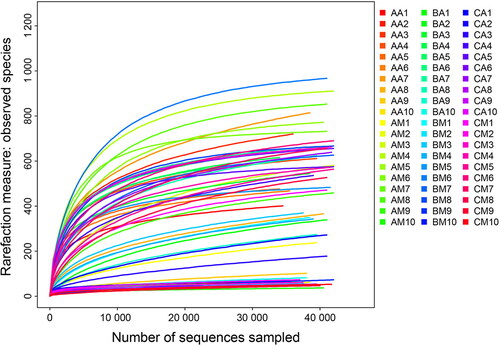
Figure 2. Shared operational taxonomic unit (OTU) analysis of the different communities. Venn diagrams showing the unique and shared OTUs in the different communities, (A) for the AM1, AM2, BM1, and BM2 communities, (B) for the AM1, AM2, CM1, and CM2 communities, (C) for the AA1, AA2, BA1, and BA2 communities and (D) for the AA1, AA2, CA1, and CA2 communities. Sample names refer to samples as described in .
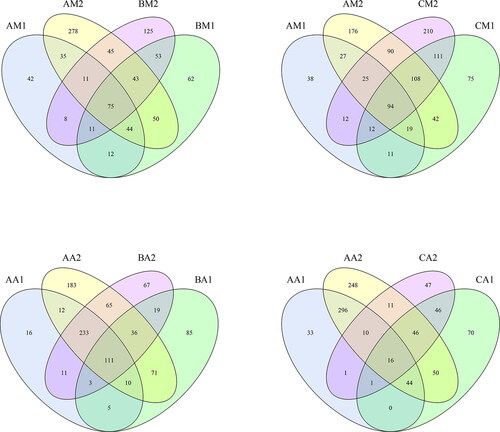
Table 1. Operational taxonomic unit (OTU)-based diversity index in New Zealand rabbit buccal cavity and rectum samples during decomposition.
Figure 3. Two-dimensional principal coordinates analysis (PCoA) plot of unweighted UniFrac distance matrices for buccal cavity and rectum samples during decomposition. The bacterial community of the buccal cavity from New Zealand rabbit carcasses in Group A (blue dot), in Group B (purple dot) and Group C (yellow dot), and the bacterial community of the rectum from New Zealand rabbit carcasses in the Group a (red dot), in Group b (green dot) and Group c (orange dot) were represented. Sample names refer to samples as described in .
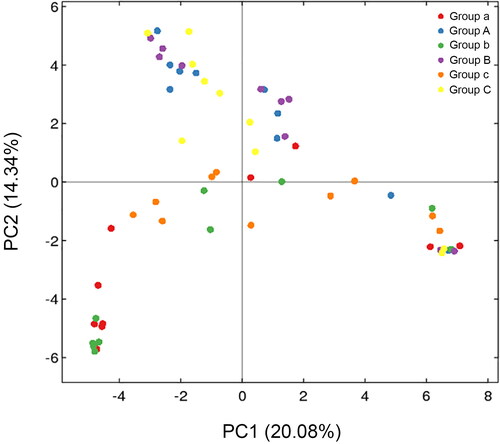
Figure 4. Hierarchical clustering of buccal cavity and rectum samples by unweighted pair group method with arithmetic mean (UPGMA) according to their weighted UniFrac matrix. Sample names refer to samples as described in .
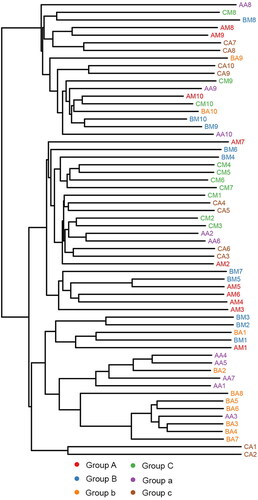
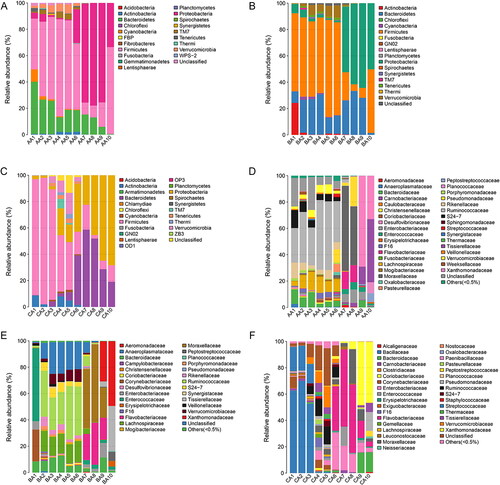
Figure 5. Bacterial community structure variation during decomposition in the buccal cavity at the phylum level and the family level. Relative abundance of bacterial phyla during decomposition in the buccal cavity in Group A (A), the buccal cavity in Group B (B), and buccal cavity in Group C (C). Relative abundance of bacterial families during decomposition in the buccal cavity in Group A (D), the buccal cavity in Group B (E) and buccal cavity in Group C (F). Sample names refer to samples as described in .
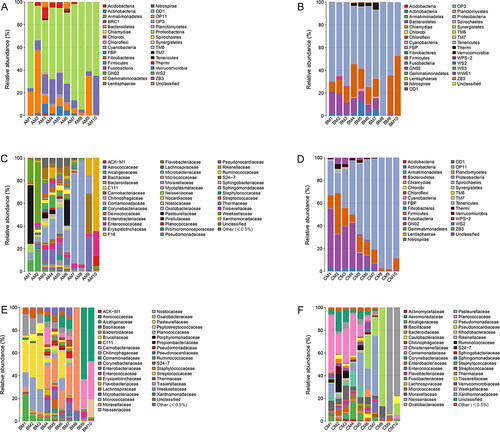
Figure 6. Bacterial community structure variation during decomposition in the rectum at the phylum level and the family level. Relative abundance of bacterial phyla during decomposition in the rectum in Group a (A), rectum in Group b (B), and rectum in Group c (C). Relative abundance of bacterial families during decomposition in the rectum in the Group a (D), the buccal cavity in Group b (E), and the buccal cavity in Group c (F). Sample names refer to samples as described in .