Figures & data
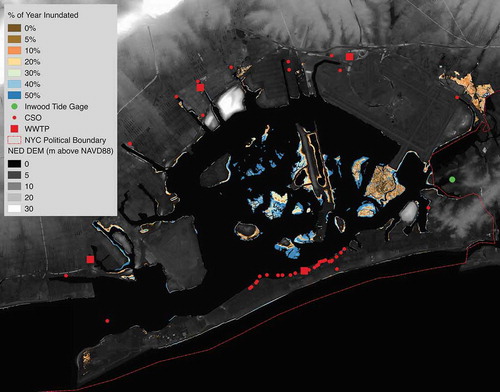
Figure 1. Examples of habitat found in temperate coastal ecosystems (a) Salt marsh islands, (b) Perimeter marsh downstream of a Combined Sewer Outfall, and (c) perimeter tidal creek and marsh platform. Images from Jamaica Bay, New York in 2011. Source: Bernice Rosenzweig.
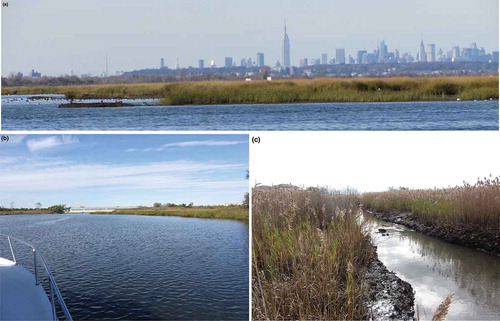
Table 1. Environmental controls on denitrification and anammox.
Figure 2. Natural (dendritic) tidal creeks and ditched (perpendicular) channels shown in a digital elevation model of two salt marsh islands of Jamaica Bay. Ditching was commonly used for mosquito control in urban wetlands during the twentieth century, but may unintentionally impact nitrogen regulation by enhancing tidal flushing and/or modifying macroinvertebrate community structure. Land elevation data are from the USA Geological Survey (USGS) 1m National Elevation Dataset https://lta.cr.usgs.gov/NED.
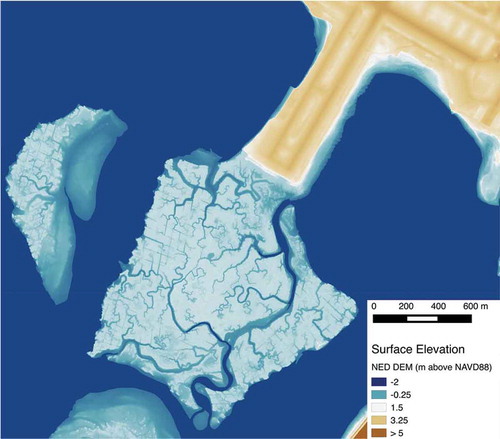
Figure 3. Simplified representation of nitrogen cycling processes in coastal ecosystems.
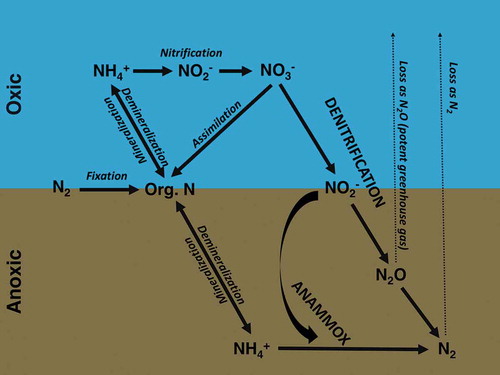
Figure 4. Hypothetical cross-section of a coastal salt marsh showing potential transport pathways of water column N and sites where denitrification may occur.
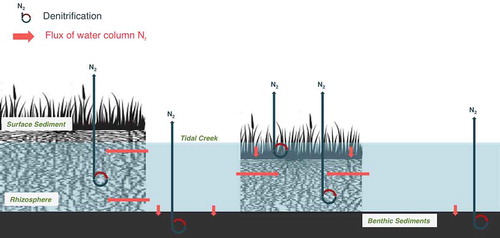
Figure 5. Map of the Jamaica Bay Watershed, which includes locations of Waste Water Treatment Plant (WWTP) Facilities and CSOs. Vegetation coverage is modified from the Ecological Covertype Map, Version 2, developed by the Natural Areas Conservancy (O'Neill-Dunne et al. Citation2014). The vegetation layer is only available for New York City. Impervious cover data is from the 2011 National Land Cover Database (Homer et al. Citation2012).
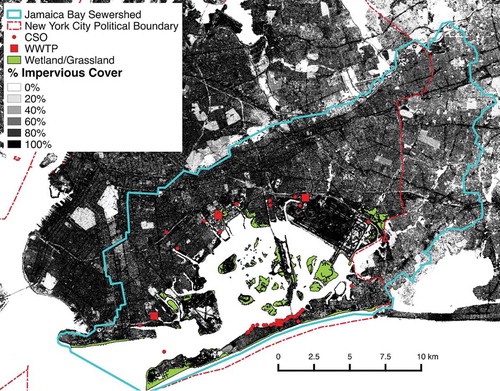
Table 2. Jamaica Bay sources of Nr.
Figure 6. N loading from the 4 Waste Water Treatment Plants (WWTPs) in the Jamaica Bay Watershed. Data from the EPA ECHO Monthly Discharge Monitoring Report (https://cfpub.epa.gov/dmr/index.cfm).
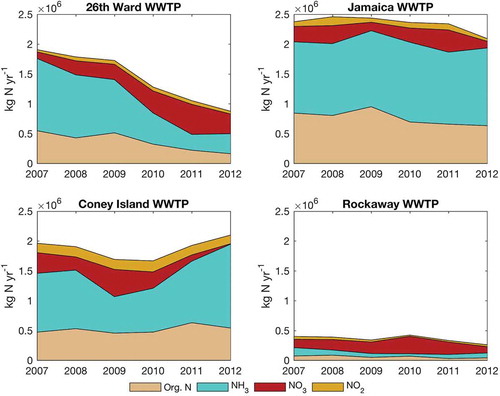
Figure 7. Annual median (a) NO3− and (b) NH4+ measured in Jamaica Bay surface waters in 2013. Data from the Jamaica Bay Water Quality Database (City University of New York (CUNY) Brooklyn College, Center for International Earth Science Information Network (CIESIN) Columbia University, New York City Department of Environmental Protection (NYCDEP), and National Park Service (NPS) Citation2017), see http://www.ciesin.columbia.edu/jbwq/parameters.html for detailed sampling methods.
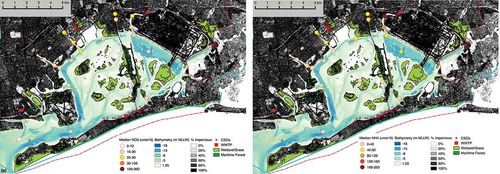
Table 3. Comparison of nitrogen removal efficiency in studies of urban coastal systems.
Figure 8. Tidal wetlands with % of example year inundated. Vegetation coverage is modified from the Ecological Covertype Map, Version 2, developed by the Natural Areas Conservancy (Forgione et al. 2015). The vegetation layer is only available for New York City and a small area of tidal wetlands outside the city’s political boundary are excluded here. Water-level time series are from Year 2013 at USGS Tide Gage 01311850 (Jamaica Bay at Inwood). Vertical adjustments were made using vData version 3.3. Land elevation data is from the USGS 1m National Elevation Dataset.