
Figures & data
Figure 1. Map of the research area
Table 1. Index system for calculating green economic efficiency
Table 2. Efficiency values of 26 cities in the Yangtze River Delta urban agglomeration from 2005 to 2015
Figure 2. Average values and coefficients of variation of green economic efficiency in the Yangtze River Delta urban agglomeration from 2005 to 2015
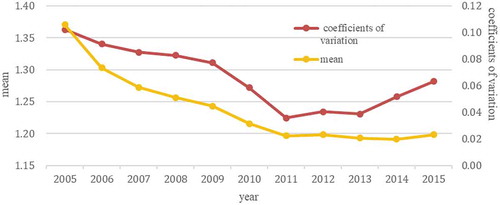
Figure 3. Changes to the average green economic efficiency values of the Yangtze River Delta urban agglomeration’s “one core and five areas” between 2005 and 2015
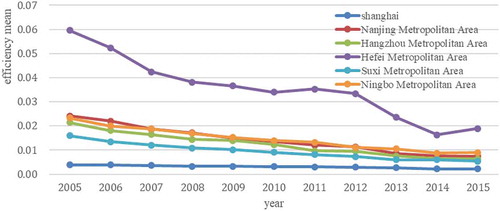
Figure 4. Spatial distribution of green economic efficiency in the Yangtze River Delta urban agglomeration
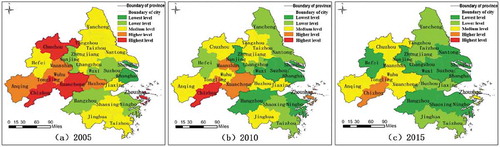
Figure 5. Moran’s I index scatterplot of green economic efficiency in the Yangtze River Delta urban agglomeration
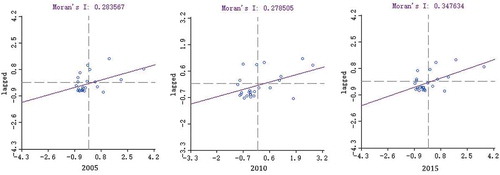
Table 3. General panel estimation results
Table 4. Random effects spatial Durbin model estimation results