
Figures & data
Figure 1. The overall process of literature selection. ① Themes: (“water quality” and “remote sensing”), patent was excluded; ② Themes: (“water quality”) AND (“remote sensing”), only document type of “Article” was included; ③ Themes: (“water color remote sensing”), patent was excluded. The search year was limited to 2016 or earlier. (c1 ~ c4 refer to the number of publications in Chinese; e1 ~ e3 mean the number of publications in English)
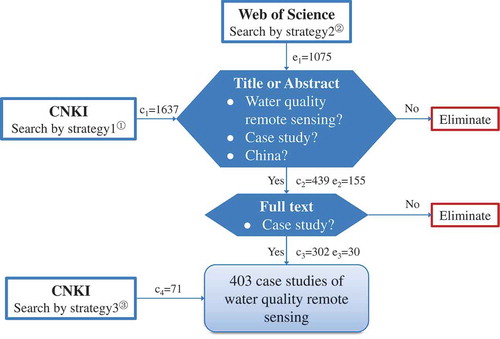
Figure 2. Temporal trend of case studies of water quality monitoring and evaluation using the remote-sensing techniques in China
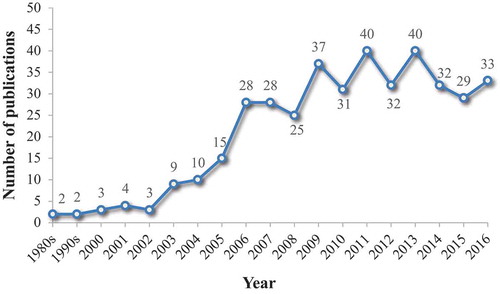
Figure 3. (a) Spatial distribution of case studies in China. For each province, we take into account the cases of coastal or nearshore water. The coastal zone contains both freshwater and seawater case studies; (b) Types of water body studied in the literature
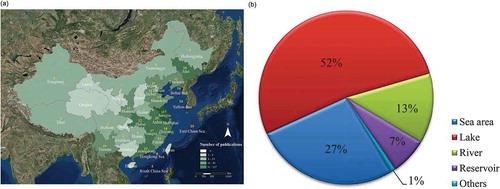
Table 1. General information of space borne and ground remote sensors used in the reviewed publications
Figure 4. The remote-sensing data resources used in the case studies for different water parameters. (GOS: Ground object spectrometer.)
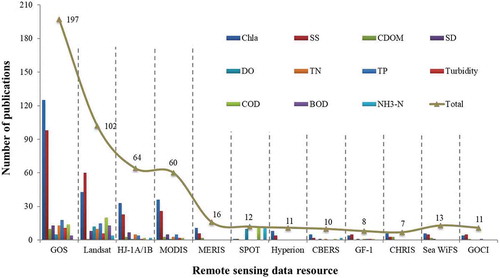
Figure 5. The total number of publications by different indicators monitored in case studies. Category 1 denotes the variables with active optical characteristics; Category 2 denotes the variables with weak optical characteristics
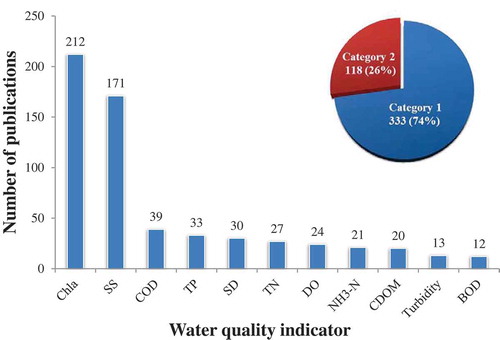
Figure 6. Methods of water quality monitoring based on remote sensing. A case study may use more than one inversion methods, so the sum of the four methods is greater than 403, the actual total number of reviewed case studies
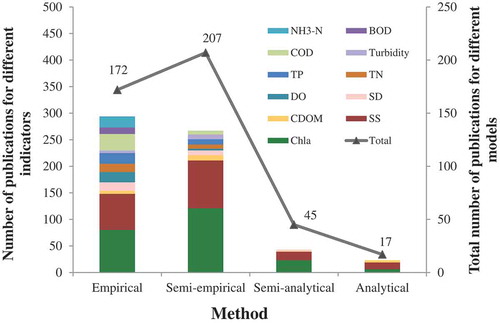
Table 2. The classification and major differences between the four inversion methods