Figures & data
Table 1. List of raw materials included in this study
Figure 1. The system boundary of iron ore (red dashed boxes) and the overview of iron and steel industry
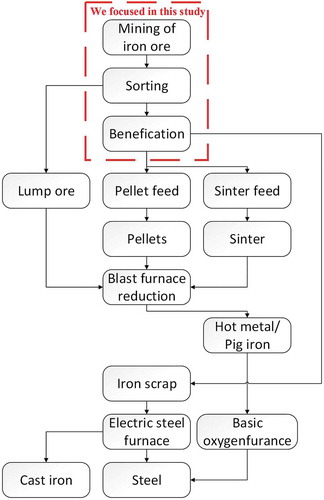
Table 2. Levels of decoupling analysis according to the value of decoupling indicators (Dr)
Table 3. Domestic Extraction (DE) and environmental impacts of raw materials exploited in China
Figure 2. Domestic extraction (DE) and environmental impacts of raw materials exploited in China, 1992–2015
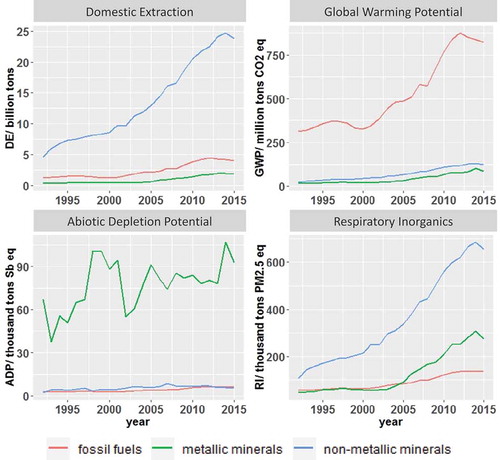
Table 4. Top 10 materials for Domestic Extraction (DE), Global Warming Potential (GWP), Abiotic Depletion Potential (ADP), and Respiratory Inorganics (RI) in China, 2015
Figure 3. Domestic extraction (DE) and environmental impacts contributions of specific materials exploited in China, 1992–2015
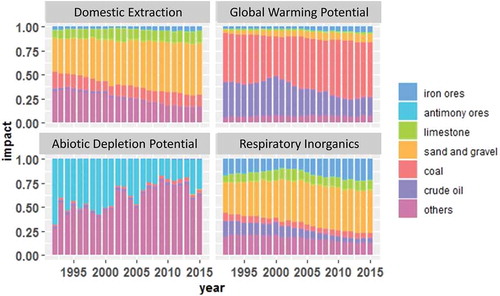
Figure 4. Decoupling analysis of DE/environmental impacts and GDP in China, 1992–2015
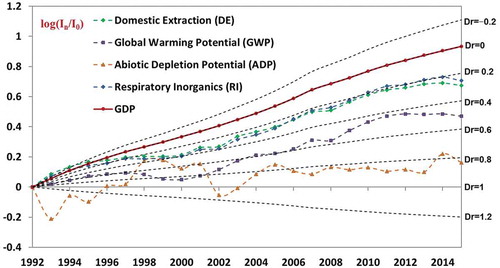
Figure 5. Decoupling analysis of DE and environmental impacts in China, 1992–2015
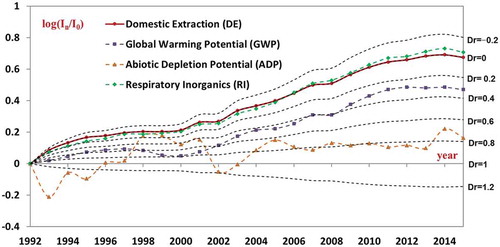
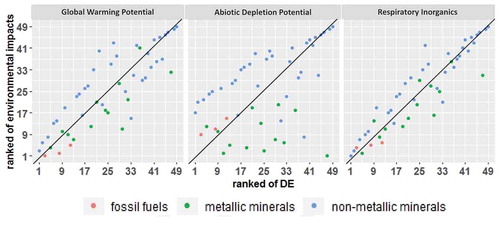
Figure 6. Ranking comparison of domestic extraction (DE), global warming potential (GWP), abiotic depletion potential (ADP), and respiratory inorganics (RI) in China, 2015