
Figures & data
Figure 1. Map of the study sites
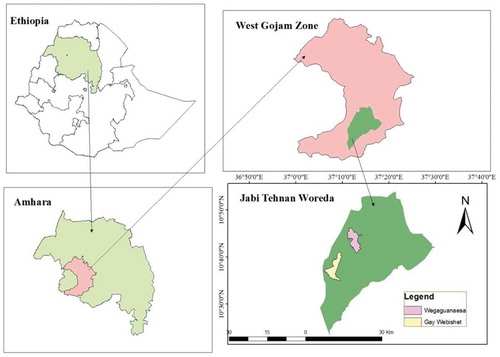
Table 1. Specific study site description
Table 2. Woody species recorded in the Wega guanaesa and Gay webishet site
Table 3. Mean ± SE basal area, density, and woody species diversity per plot
Figure 2. Population structure of woody species in adjacent open grazing land of Wega guanaesa site
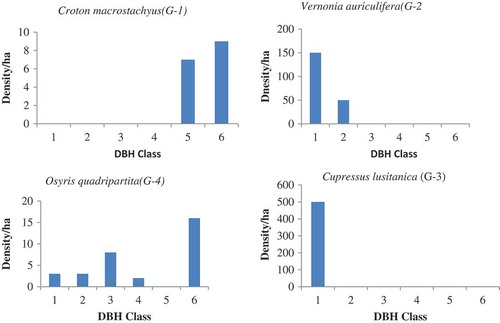
Figure 3. Population structure of woody species in exclosure land of Wega guanaesa site
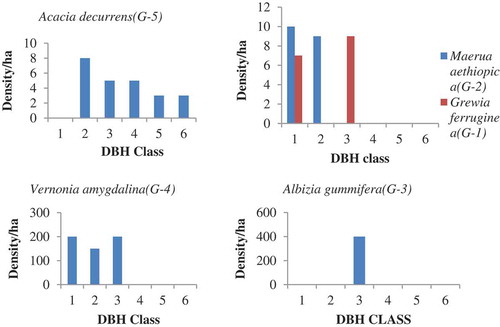
Figure 4. Population structure of woody species in adjacent open grazing land of Gay webishet site
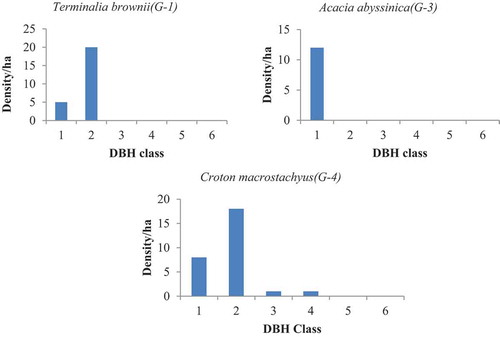
Figure 5. Population structure of woody species in exclosure land of Gay webishet site
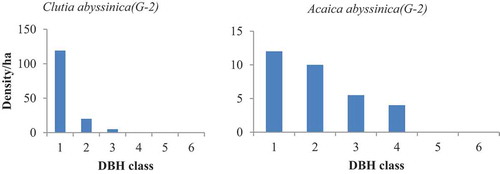
Table 4. Mean ± SE of woody species abundance, richness and evenness per plot
Table 5. List of woody species recorded with their density, frequency, abundance, dominance at Gay webishet site
Table 6. List of woody species recorded with their density, frequency, abundance, dominance at Wega guanaesa site