Figures & data
Table 1. No external satellite accounts for ecosystem services
Table 2. Current SEEA EEA
Table 3. SEEA EEA with adjusted NVA
Table 3. (Continued)
Figure 1. Graphical simplification of the complementary supply and use tables built for the SEEA–EEA
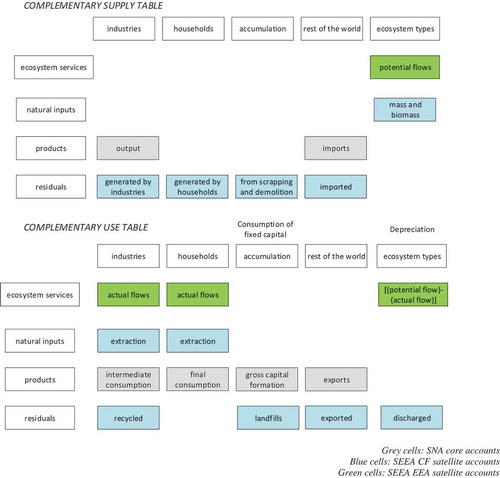
Figure 2. Graphical simplification of the NVA adjusted for the depreciation of natural capital
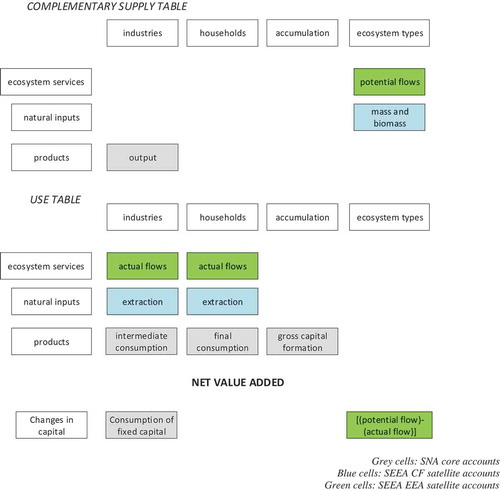
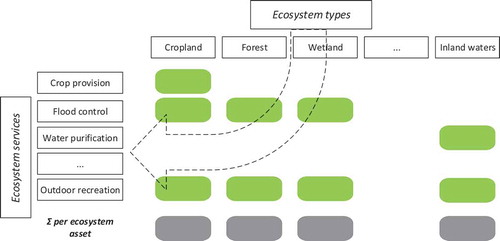
Figure 3. Graphical simplification of the linkage between ecosystem services and ecosystem assets (adapted from La Notte, Vallecillo, and Maes Citation2019b)