Figures & data
Figure 1. The investigation map in the neSCS (R: Typhoon Roke route; H: Typhoon Haitang route; K: Kuroshio current intrusion route)
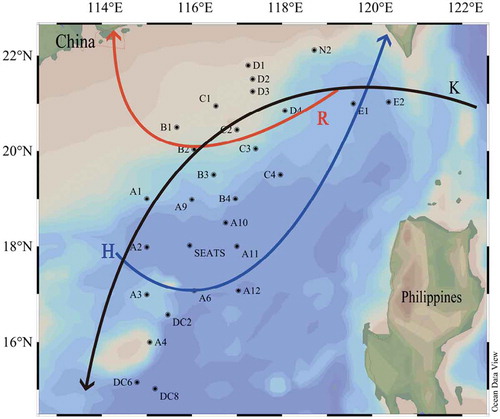
Figure 2. The temperature (a) and salinity (b) distribution of 5 m water depth in the survey area
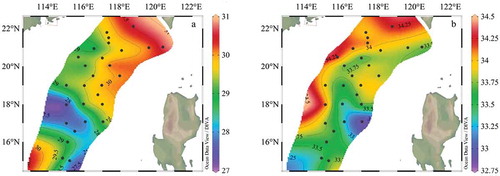
Figure 3. Sectional distribution of temperature (a) and salinity (b) in section K
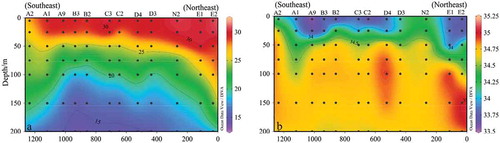
Figure 4. Sectional distribution of temperature (a) and salinity (b) in section R
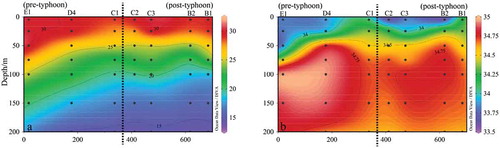
Figure 5. Sectional distribution of temperature (a) and salinity (b) in Section H
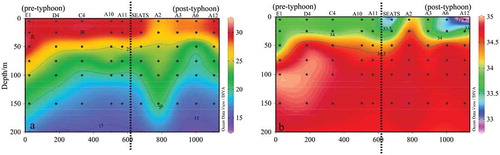
Table 1. Dominant phytoplankton species in the northeastern South China sea in summer 2017
Figure 6. Vertical distribution of phytoplankton cell abundance (Log base 10). (a): Phytoplankton; (b): Bacillariophyta;(c): Dinophyta; (d): Cyanophyta
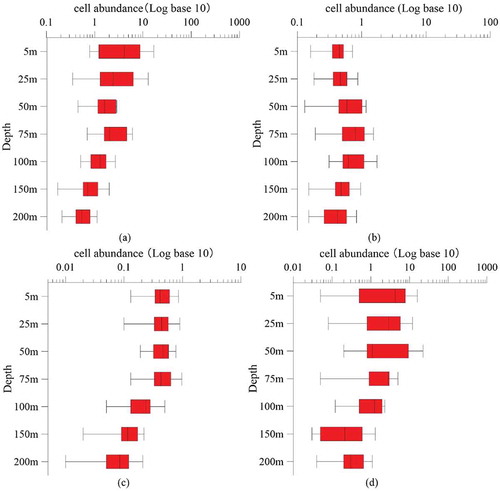
Figure 7. Horizontal distribution of phytoplankton cell abundance in the surface water layer (103 cells L−1). (a): Phytoplankton; (b): Bacillariophyta; (c): Dinophyta; (d): Cyanophyta
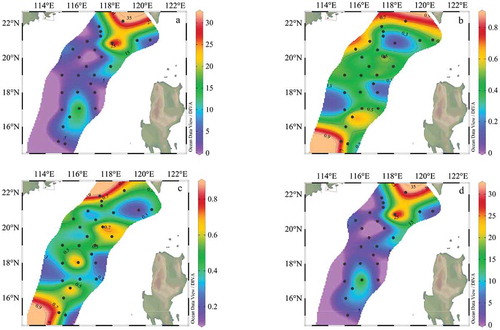
Table 2. Horizontal distributions of the dominant species in the survey area
Figure 8. Horizontal distribution of dominant species (103 cells L−1). (a): Trichodesmium thiebautii; (b): Thalassionema nitzschioides; (c): Thalassionema frauenfeldii; (d): Prorocentrum compressum; €: Thalassiosira minima; (f): Prorocentrum minimum; (g): Thalassiothrix longissima; (h): Navicula spp.; (i): Prorocentrum compressum; (j): Cyclotella striata
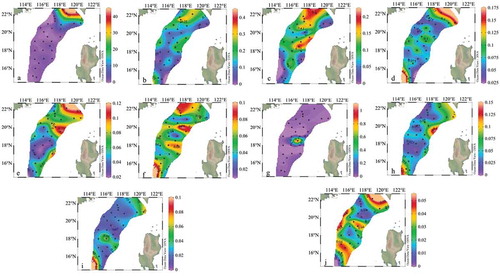
Figure 9. Horizontal distribution of Shannon–Wiener diversity index (a) and Pielou’s evenness index (b) surface for phytoplankton communities
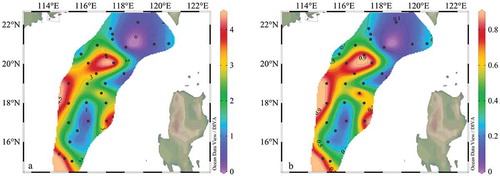
Table 3. Historical data of the phytoplankton community in the northern South China sea in summer
Table 4. Pearson correlation between phytoplankton and environmental factors
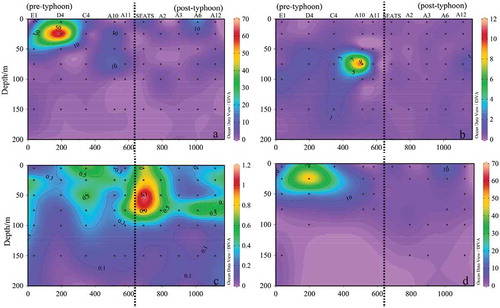
Figure 10. Sectional distribution of phytoplankton abundance in Section K (103 cells L−1). (a): Phytoplankton; (b): Bacillariophyta; (c): Dinophyta; (d): Trichodesmium thiebautii.
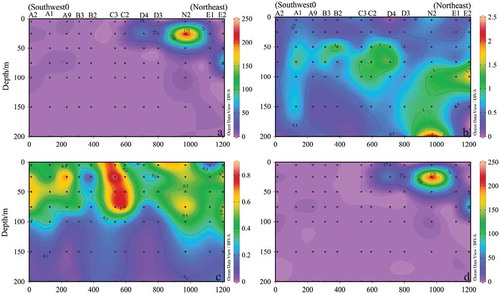
Figure 11. Sectional distribution of phytoplankton abundance in Section R (103 cells L−1). (a): Phytoplankton; (b): Bacillariophyta; (c): Dinophyta; (d): Cyanophyta
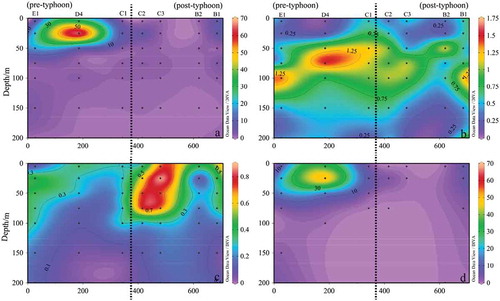
Figure 12. Sectional distribution of phytoplankton abundance in Section H (103 cells L−1). (a): Phytoplankton; (b): Bacillariophyta; (c): Dinophyta; d: Cyanophyta