
Figures & data
Figure 1. The location of Zhoushan City in China
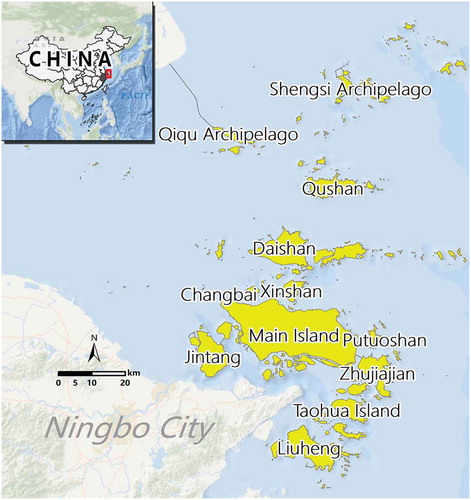
Table 1. The detailed information about the images used for LULC classification
Figure 2. Example of ESSI calculation: With the same value of four ecosystem services (2014), the relative position of the four in the diamond map resulting in a different irregular polygon which occupied different area of the total area. With four kinds of ecosystem services, there are three different relative positions which means three different display orders. In this example habitat quality, water yield, soil sediment, and carbon storage are equal to 0.8, 0.2, 0.4, and 0.6, respectively. The area proportions of different relative position (display orders) respectively yield 0.21, 0.24, and 0.25 which means the final figure for the ESSI, in this case, was 0.233 (the average of the three)
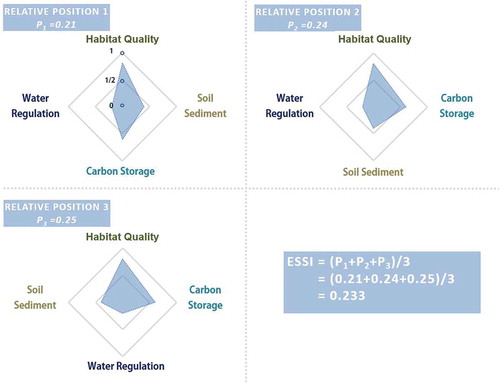
Table 2. The area and percentage of LULC from 1984 to 2014 in Zhoushan City. Ecosystem services in LULC (city scale) are represented by the percentage of ecosystem services provided by different LULC in total ecosystem services
Figure 3. The distribution of LULC in Zhoushan City on the city scale(1984–2014)
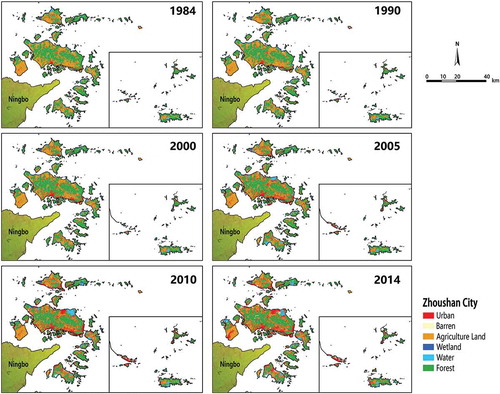
Table 3. Transition Matrix of LULC Type from 1984 to 2014 (ha)
Table 4. The average values of ecosystem services change index (ESCI) and the average values of ecosystem services status index (ESSI) from 1984 to 2014 on the city scale and reclamation-area scale. Habitat quality has no unit; the unit of soil sediment and carbon storage is ton per hectare (t/ha), and the unit of water yield is millimeter (mm). The unit of ESSI is the percentage (%)
Table 5. The degradation area and improvement area of habitat quality, carbon storage, soil sediment and water yield in Zhoushan City across the study period (city scale)