Figures & data
Table 1. Basic information of soils for this displacement measurement
Figure 1. Boxplots of the soil-air TGM exchange fluxes (ng m−2 d−1) during different growth stages of maize-wheat in each plot (a–e); Accumulative soil-air TGM exchange fluxes (ug m−2) during the whole observation in the five plots (f)
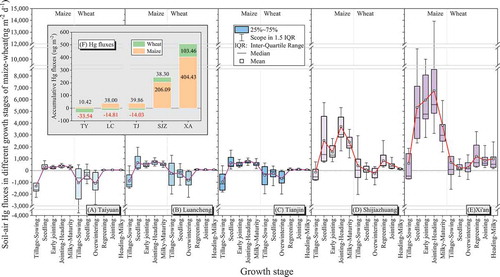
Figure 2. Effects of soil total mercury concentration (a), soil temperature (b), and soil moisture (c) on soil-air TGM exchange fluxes and the ratios of soil-air TGM exchange flux between daytime and nighttime (d) in different sewage irrigation plots (mean ± SD)
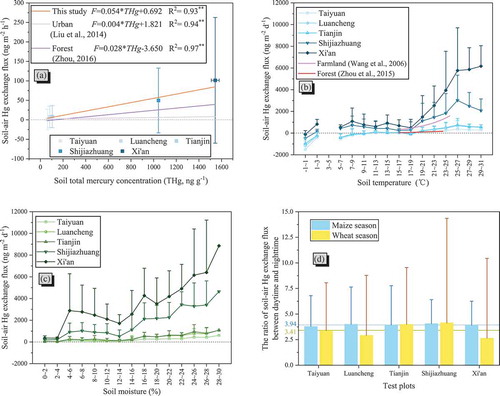
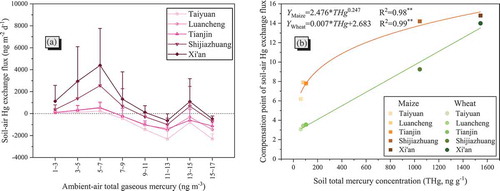
Figure 3. (a) Effect of ambient-air total gaseous mercury on soil-air TGM exchange flux in different sewage irrigation plots; (b) Correlation between total soil mercury concentration and compensation points of soil-air TGM exchange