Figures & data
Figure 1. The impact of anthropic disturbance such as residential area and road on the hypothetical boundary of buffer zone and transition zone. The background picture was captured by a DJI Mavic Pro drone
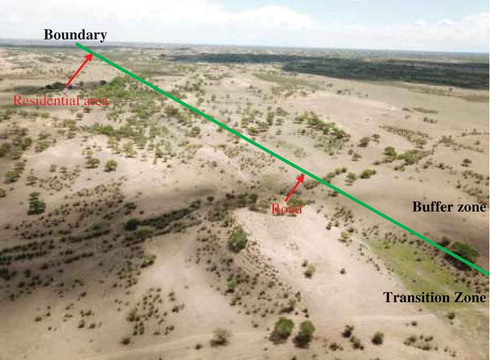
Figure 2. (a) Paired change of Species-Area Relationship and Endemics-Area Relationships due to the underestimated or overestimated total number of species. A is the total area, SA is the real number of species in area A, Su is the underestimated number of species in area A, and So is the overestimated number of species in area A. (b) Paired change of Species-Area Relationship and Endemics-Area Relationships due to different total areas ,
and
. A is the total area of core zone,
is the reduced total area of core zone, and
is the total area of core zone, buffer zone and transition zone. The number of species SA in area A is assumed as the same in the areas
and
. (c) Paired change of Species-Area Relationship (SAR) and Endemics-Area Relationships (EAR) due to the change of species-abundance. A is the total area, SA is the real number of species in area A. The dashed lines and arrows represent the disturbance and change of SAR, respectively. (d) Two pairs (SAR-EAR and SAR’-EAR’) of Species-Area Relationship (SAR) and Endemics-Area Relationships (EAR) due to the change of species-abundance. A is the total area, SA is the real number of species in area A. The dashed lines and arrows represent the disturbance and change of SAR, respectively