Figures & data
Figure 1. Topography (a) and land cover types (b) of the study area. Black stars represent the observations for eddy covariance system stations
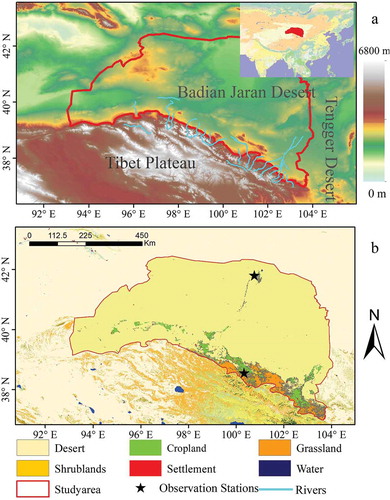
Table 1. The land-cover types in the Hexi Corridor oasis and its surrounding desert integrated from the International Geosphere-Biosphere Program classification scheme of MODIS and the proportion of their areas
Figure 2. Daily variation in land-surface temperature (LST) and oasis effect intensity (OEI) in all land-cover types (including desert) in 2016. The hollow dots represent the average of the day, the solid dots represent the average of the night, the black symbols represent the LST, the red symbols represent the OEI, and the gray error line represents the standard deviation (hereafter)
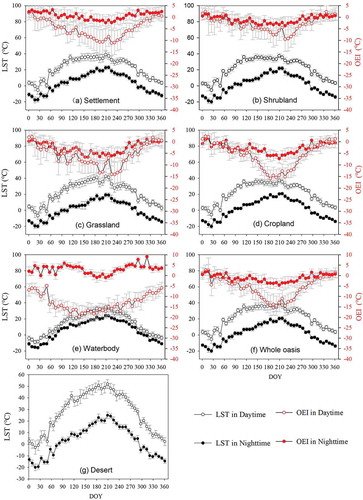
Figure 3. Seasonal variation of oasis effect intensity (OEI) for all oasis land-cover types in 2016
Table 2. Linear regression equations between oasis effect intensity (OEI) and land-surface temperature (LST) for different land-cover types (LCTs)
Figure 4. Scatter plots of oasis effect intensity (OEI) vs. land-surface temperature (LST) for different land-cover types (LCTs) in the daytime and nighttime
Figure 5. Seasonal variations of OEI (mean ± SD), ET (mean ± SD) and albedo OEI (mean ± SD), the difference of OEI between daytime and nighttime, and the difference of ET and albedo between oasis and desert
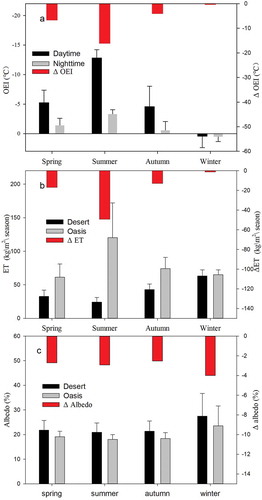
Figure 6. The snow coverage ratio of the desert and oasis from October to April of the following year in the study area
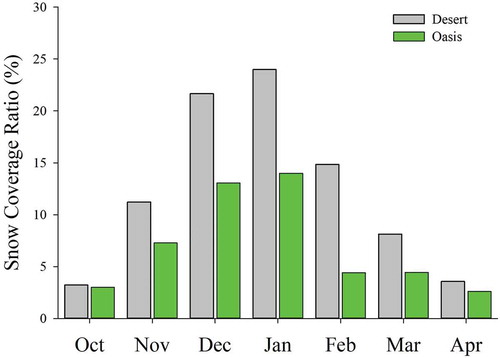
Table 3. Albedo and evapotranspiration (ET) values for different oasis land-cover types
Figure 7. Changing curves of surface energy balance for cropland and desert in different seasons (mean ± SD). Data is collected from eddy covariance systems. Terms as a function of time in the desert (right) and cropland (left) station in winter (top), spring (second row), summer (third row), and autumn (bottom). Rn is the net radiation, Hs the sensible heat flux, LE the latent heat flux, and Gs the soil heat flux. The insets show the average value of surface energy balance related to the main box from 12:00 to 14:00 (when the energy peaked)