Figures & data
Table 1. Attributes and levels of the policy alternatives
Table 2. Socio-economic characteristics of respondents under each policy alternative
Table 3. Respondents’ expected effects of congestion charge, general and traffic-related environmental concerns in cities in related studies
Table 4. Correlations among environmental concerns a.
Table 5. Bivariate correlations between environmental concerns and selected demographic variables a.
Table 6. Rotated factor loadings of environmental concern variables
Table 7. Description of variables
Table 8. Influencing factors of support for the congestion charge (N = 860)
Figure 1. Respondents’ perception of the main causes of air pollution in Beijing
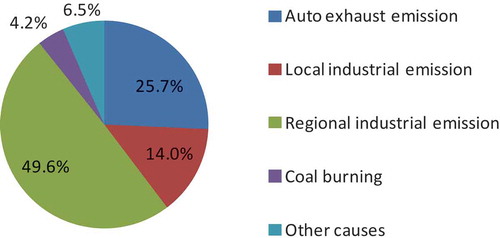
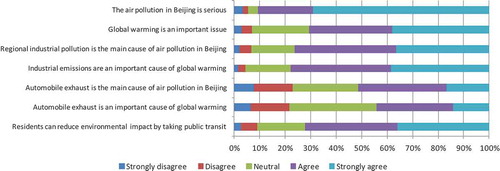
Figure 2. The industrial and traffic related environmental concerns of respondents in Beijing