Figures & data
Figure 1. Study sites of Lake Taihu
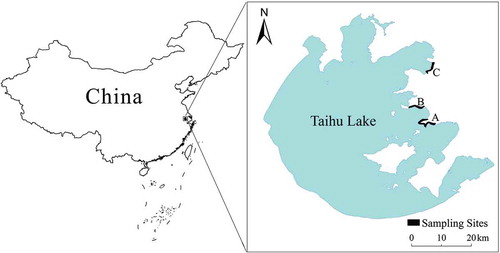
Table 1. Species richness and abundance of soil fauna at different stages of wetland restoration
Figure 2. Densities of soil fauna in the three different wetland areas. The bars represent the mean values and the error bars represent the standard error
Figure 3. Diversity of the soil fauna communities in the three different wetland areas. The bars represent the mean values and the error bars represent the standard error
Figure 4. Diversity of the soil fauna communities at different stages of restoration. The bars in figures represent the mean values and the error bars represent the standard error
Table 2. Correlation of environmental variables with the ordination axes
Table 3. Canonical correlation analysis results
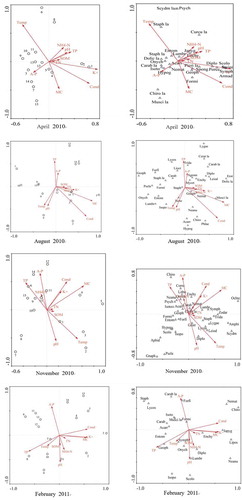
Figure 5. Canonical correspondence analysis ordination diagrams of soil fauna groups and environmental variables