Figures & data
Figure 1. Location of the Xilingol grassland (a). Elevation of the Xilingol grassland and distributions of the field verification sites (b); Distribution of meteorological stations, annual precipitation, and its vegetation types (c). DW, Dongwuzhumuqin Banner; XW, Xiwuzhumuqin Banner; XL, Xilinhot; AB, Abaga Banner; SZ, Sunitezuo Banner; SY, Suniteyou Banner; EL, Erlianhot; XH, Xianghuang Banner; ZXB, Zhengxiangbai Banner; ZL, Zhenglan Banner; DL, Duolun
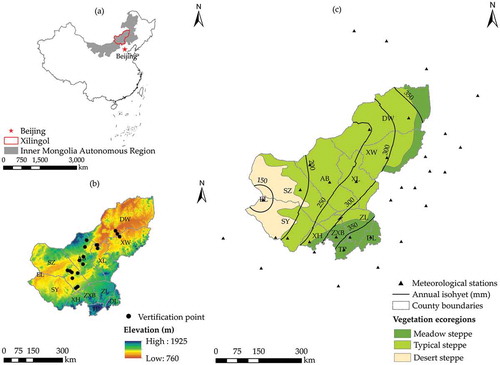
Figure 2. Correlation between estimated NPP and observed NPP in Xilingol grassland in July 2014
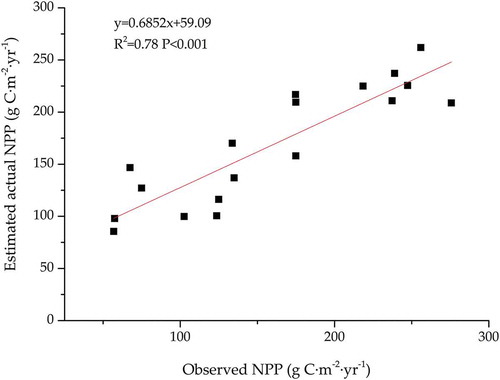
Figure 3. Processing flows for distinguishing the contribution of land conversion, grazing management, and climate variation to changes in NPP
Table 1. Area of land use change in Xilingol from 2000 to 2015. (unit: km2)
Figure 4. Spatial distribution of gains and losses in the Xilingol grassland between 2000 and 2015
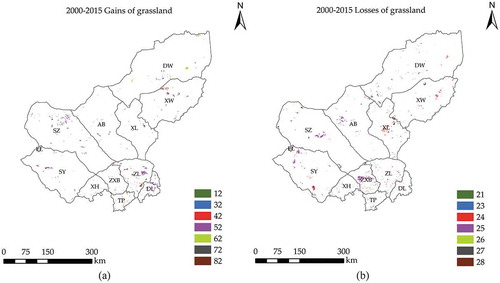
Table 2. Gains and losses in the Xilingol grassland from 2000 to 2015
Figure 5. (a) Spatial distribution of coverage change in unchanged grassland from 2000 to 2015 and (b) coverage change in eleven administrative sub-regions
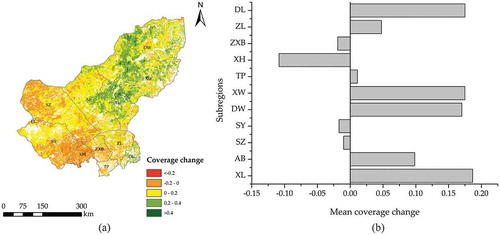
Figure 6. (a) Inter-annual variations in annual average actual NPP and climate-induced NPP in the Xilingol grassland from 2000 to 2015; (b) Actual NPP change of Xilingol grassland between 2000 and 2015
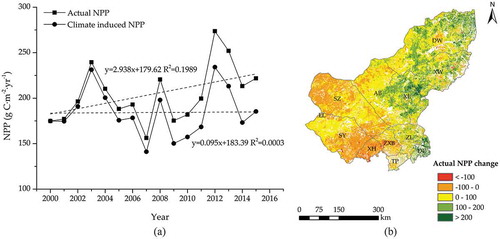
Table 3. NPP changes caused by different forms of grassland conversion between 2000 and 2015
Figure 7. The contribution of land conversion to total NPP changes in the sub-regions between 2000 and 2015
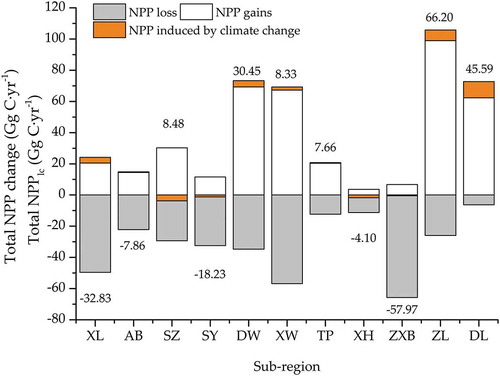
Table 4. Quantitative analysis of the contributions of climate variation and human activities to NPP changes in the Xilingol grassland between 2000 and 2015
Figure 8. (a) Spatial distribution of NPP changes induced by climate variation, (b) land conversion and (c) management measures in the Xilingol grassland between 2000 and 2015 (Unit: g C·m−2·yr−1)
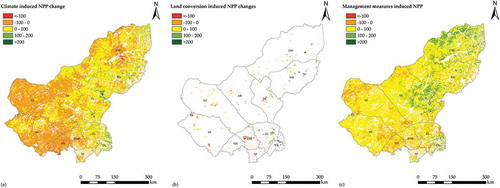
Figure 9. Spatial changes in precipitation and temperature in Xilingol grassland from 2000 to 2015
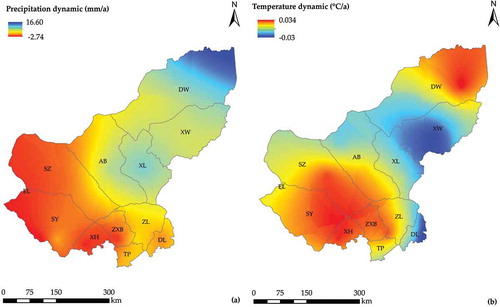
Figure 10. Changes of urbanization, road construction (a) and coal production (b) in Xilingol from 2000 to 2015
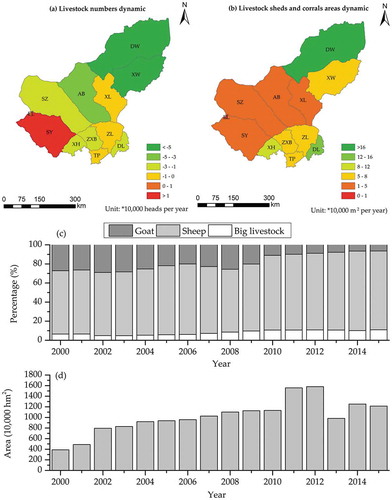
Figure 11. (a) Spatial pattern of the livestock number trends in the Xilingol grassland from 2000 to 2015, (b) Spatial pattern of livestock sheds and corrals; Inter-annual variation in livestock structure (c) and fenced grassland area (d)