Figures & data
Figure 1. Spatial distribution of 1986–2005 mean Tmax (1st row), Tmin (2nd row) and DTR (3rd row) in the main BRI regions for the CRU observations (left panel) and MME mean simulations (right panel) (unit: °C). MME mean simulations are calculated using statistically downscaled data for 18 global coupled models
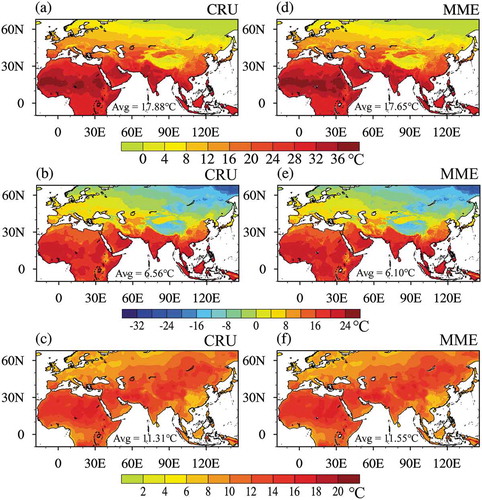
Figure 2. Spatial distribution of the temperature differences in the main BRI regions between the MME mean simulations and the CRU observations (unit: °C):: (a) Tmax; (b) Tmin; and (c) DTR. MME mean simulations are calculated using statistically downscaled data for 18 global coupled models
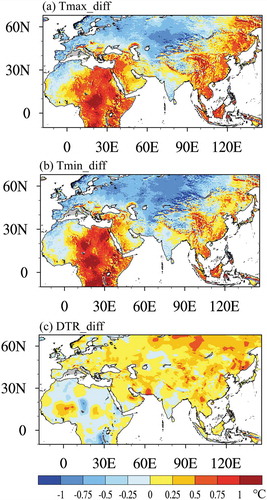
Figure 3. MME mean projected changes of Tmax in the next 20 years (2020–2039) and the late 21st century (2080–2099) with regard to the historical period for RCP4.5 (left panel) and RCP8.5 (right panel) over the main BRI regions. The slash areas are significant at the 95% confidence level
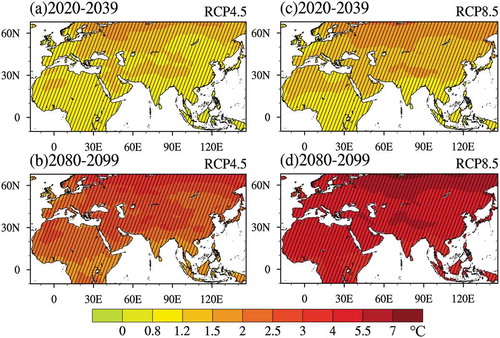
Figure 4. Same as Figure 3 but for Tmin.
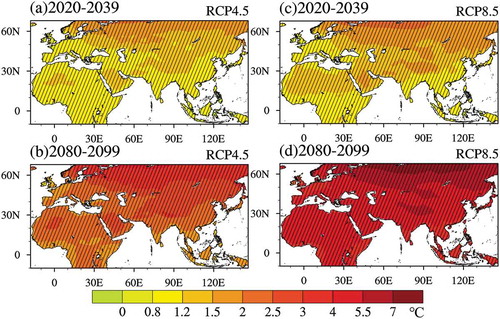
Figure 5. Same as Figure 3 but for the DTR. The green and black boxes in Figure 5(d) indicate the two selected key regions
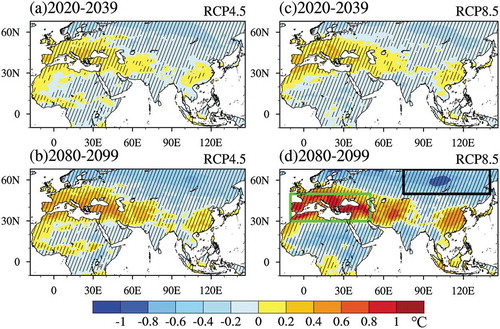
Figure 6. MME mean projected changes of Tmax (left panel) and Tmin (right panel) averaged over the main BRI regions, the Mediterranean and Black Sea region and North Asia in the next 20 years and the late 21st century with regard to the historical period for RCP4.5 and RCP8.5 (unit: °C). ★ represents that MME mean projected change is significant at the 99% confidence level. The error bar indicates ±one standard deviation among the 18 global coupled models
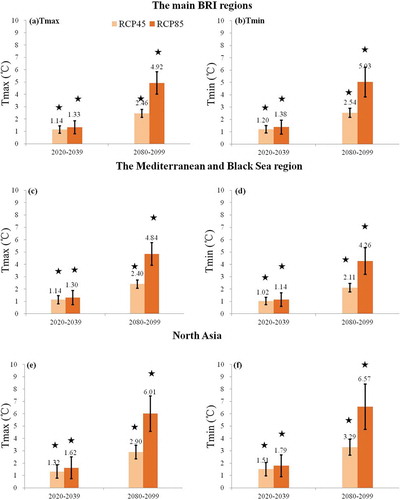
Figure 7. Same as Figure 6 but for the DTR. ▲ represents that MME mean projected change is significant at the 95% confidence level. The error bar denotes ±one standard deviation for the 18 global coupled models
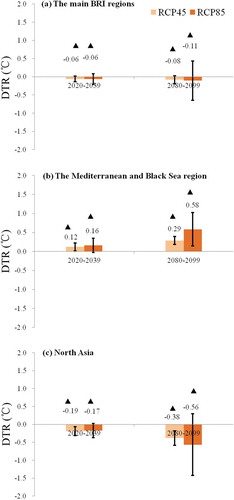
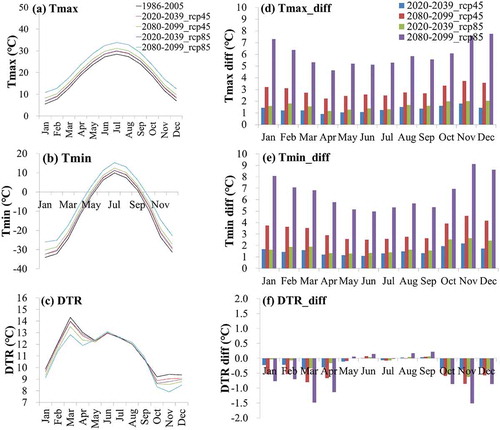
Figure 8. The monthly values of Tmax, Tmin and DTR for the historical period, the future 20 years and the late 21st century (left panel) for RCP4.5 and RCP8.5 averaged over the main BRI regions and the differences between the two future periods (2020–2039 and 2080–2099) and the historical period (right panel)
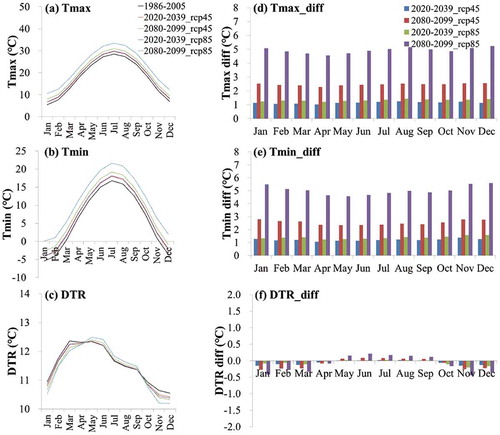
Figure 9. Same as Figure 8 but for the Mediterranean and Black Sea region as enclosed by the green box in Figure 5(d)
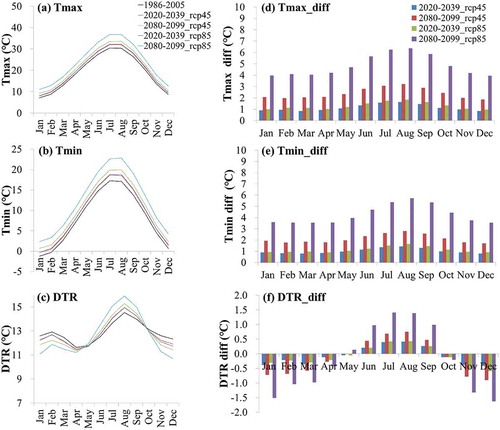
Figure 10. Same as Figure 8 but for North Asia as enclosed by the black box in Figure 5(d)