Figures & data
Table 1. Existing global multi-region input–output databases and their main features
Figure 1. Composition of global production-based and consumption-based GHG emissions and changes in net embodied emissions in 2004, 2007, and 2011
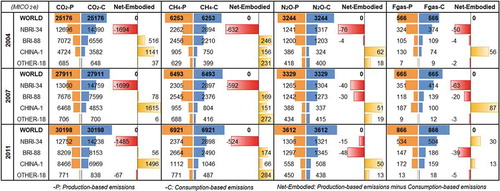
Figure 2. Composition in per capita production-based and consumption-based GHG emissions in 2004, 2007, and 2011
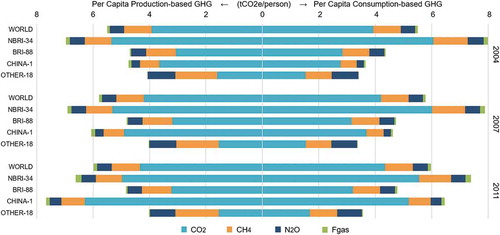
Figure 3. Sectoral contribution of production-based and consumption-based emissions of specific GHGs, 2011
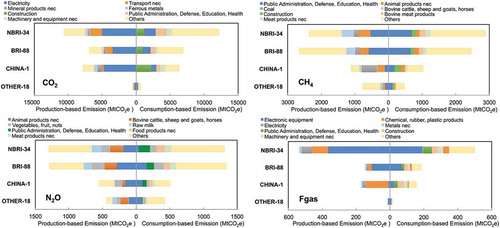
Figure 4. Comparison of population, GDP, and GHG emissions by groups with different levels of development in 2011
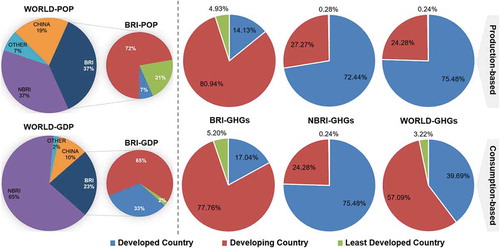
Figure 5. Per capita GHG emissions of BRI-88 and groups with different development levels
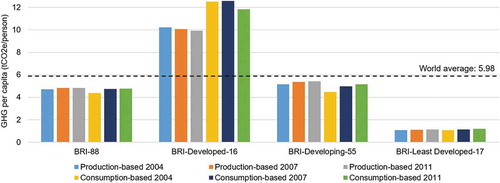
Figure 6. Per capita GHG consumption emissions of countries within the BRI-88 and NBRI-34 groups – GDP per capita distribution, 2011
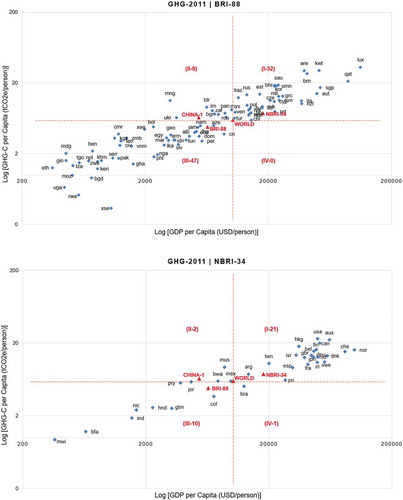
Figure 7. Composition of production and consumption emissions and changes in the net embodied emissions of BRI-88 and its groups with different levels of development in 2004, 2007, and 2011
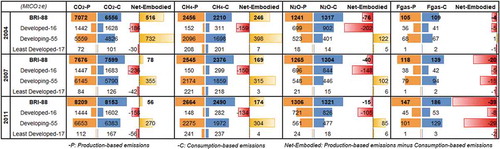
Figure 8. Global GHG import and export emissions flows in 2004, 2007, and 2011
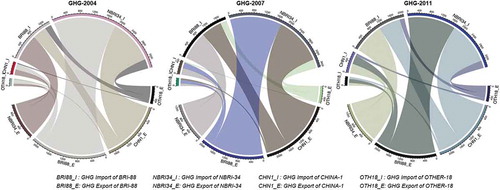
Figure 9. Global import and export emissions flow of four types of GHGs in 2011
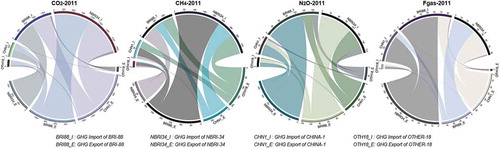
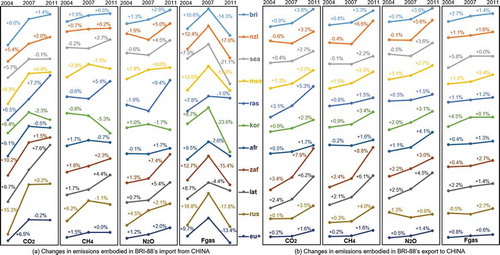
Figure 10. Changes in embodied emissions of imports and exports between China and BRI-88, as well as countries and regions within the domain, in 2004, 2007, and 2011