Figures & data
Figure 1. The map of Southeast Asia.
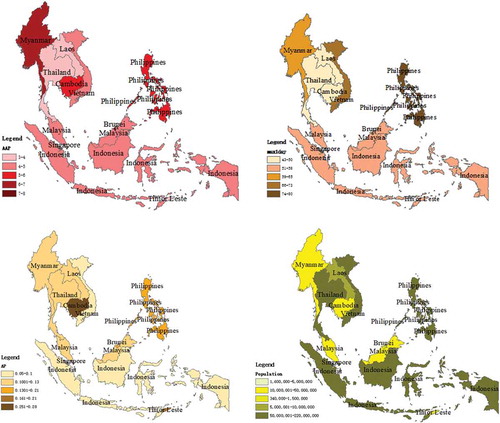
Figure 2. The bilateral investment between China and BRI countries vs Southeast Asia.
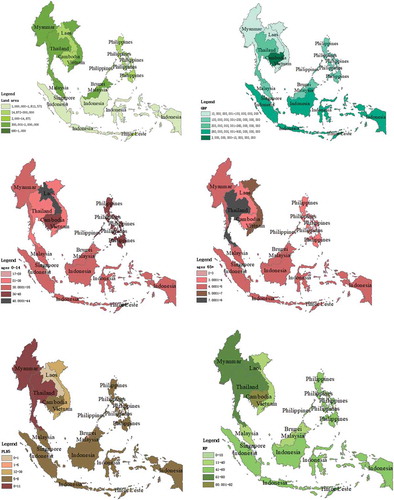
Table 1. The disasters in Southeast Asia between 1900 and October 2019.
Table 2. The measurement for flood risk level.
Figure 3. Spatial distribution of indicators among different countries.
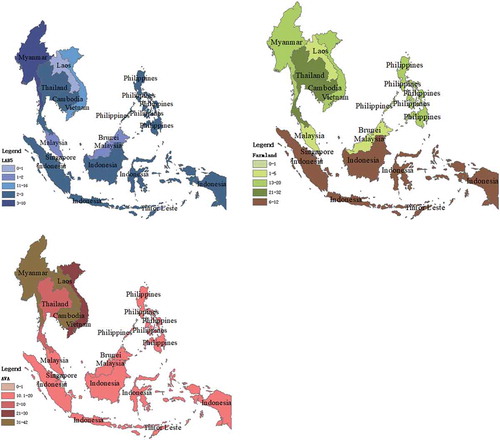
Table 3. The weights of flood risk indicators using CV.
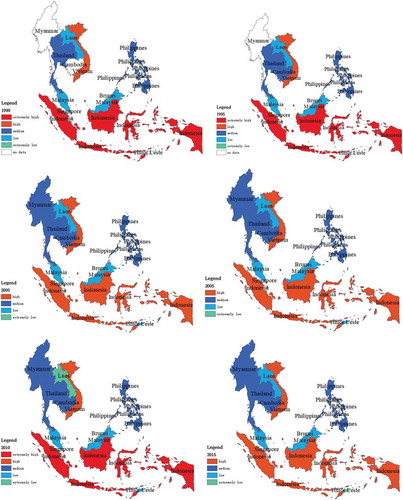
Figure 4. The risk map of the study area during the random years.