13,590
Views
46
CrossRef citations to date
0
Altmetric
Review

Ecology of industrial pollution in China

, , , , , , , , , , & show all
Article: 1779010 | Received 04 Nov 2019, Accepted 29 May 2020, Published online: 21 Jun 2020

Figures & data

Figure 1. Industrial-added value from 1978 to 2018 in China.

Figure 1. Industrial-added value from 1978 to 2018 in China.

Figure 2. Industrial discharge from different regions in China from 1986 to 2015.

Figure 2. Industrial discharge from different regions in China from 1986 to 2015.

Figure 3. Variation of pollution index and industrial-added value in China from1995 to 2015.Data sources: China Statistical Yearbook (1996, 2001, 2006, 2011 and 2016). Some data of wastewater, waste gas and solid waste were not available in Beijing, Hebei, Liaoning, Chongqing, Guizhou and Tibet in 1995, pollution index values in these regions were non-applicable. Gray indicates no data.

Figure 3. Variation of pollution index and industrial-added value in China from1995 to 2015.Data sources: China Statistical Yearbook (1996, 2001, 2006, 2011 and 2016). Some data of wastewater, waste gas and solid waste were not available in Beijing, Hebei, Liaoning, Chongqing, Guizhou and Tibet in 1995, pollution index values in these regions were non-applicable. Gray indicates no data.

Figure 4. Schematic of industrial pollution on the aquatic and soil ecosystems.

Figure 4. Schematic of industrial pollution on the aquatic and soil ecosystems.

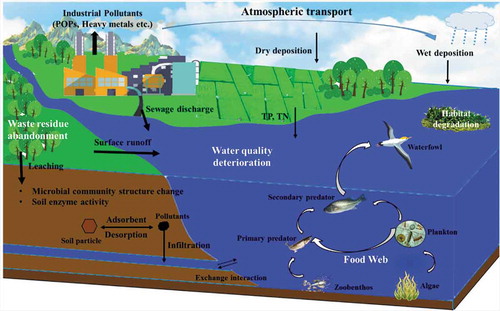
Table 1. Effects of different pollutants on the elements of aquatic ecosystem.

Table 2. Soil pollution status in different industrial block types.

Figure 5. Distribution of watershed monitoring stations and water quality conditions of the major watersheds (MEEPRC Citation2018).

Figure 5. Distribution of watershed monitoring stations and water quality conditions of the major watersheds (MEEPRC Citation2018).

Table 3. Major industries and pollutants in different types of industrial-contaminated sites in China.

Figure 6. Framework for the development of ecological risk assessment.

Figure 6. Framework for the development of ecological risk assessment.