Figures & data
Figure 1. Map of Zhangjiang Estuary showing the study area in Fujian Province, China.
Figure 2. Dispersal patterns of S. apetala individuals in the 2014 survey and 2018 survey with the (a) surface soil salinity and (d) sediment elevation of Zhangjiang Estuary. The relation between the distribution of soil salinity and (b) crown area and (c) the dispersal number and the relation between the elevation and (e) crown area and (f) the dispersal number. The 95% confidence interval (the blue lines) according to the Weibull distribution analysis is indicated.
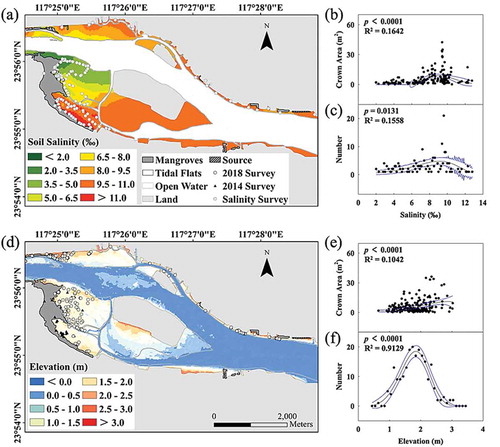
Table 1. Growth status of S. apetala in Zhangjiang Estuary in 2014 and 2018.
Figure 3.. Growth status of seedlings in salinity treatments in a greenhouse. (a) Germination percentage of S. apetala individuals, (b) aboveground biomass (AGB) and belowground biomass (BGB) of S. apetala seedlings, (c) survival percentage of the 80-day culture and (d) the root/shoot ratio of S. apetala individuals. Error bars indicate the standard error (SE) of the average (n = 3). Dead indicates seedlings that were dead after 10 days of growth. NS indicates no significant difference. Different letters represent significant differences among the five salinity treatments according to a one-way ANOVA with the LSD test at p ≤ 0.05.
Figure 4. Growth status of seedlings under the elevation treatments in the marsh organs. (a) Aboveground biomass (AGB) and belowground biomass (BGB) of S. apetala seedlings at harvest (after a one-year culture) and (b) the root/shoot ratio of S. apetala seedlings. The error bar indicates the standard error (SE) of the average (n = 4). The different letters indicate significant differences among the four elevation treatments according to one-way ANOVA with the LSD test at p ≤ 0.05. M indicates the treatment for the current elevation of the natural distribution, S indicates the current elevation of the mangrove seaward edge, RCP 4.5 indicates the future elevation under the RCP 4.5 scenarios, and RCP 8.5 indicates the future elevation under the RCP 8.5 scenarios.
Figure 5. Results of the path of dispersing S. apetala propagules released in different periods (a – f) within several tidal cycles by the FVCOM model and continued subsection results (g – j) based on the suitable result of (f). The red symbols and the white lines are the seeds of S. apetala and the trajectory of floating seeds, respectively.
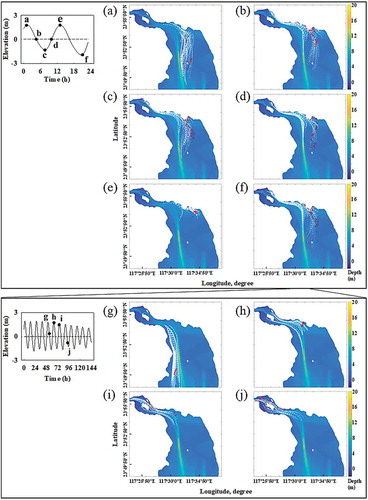
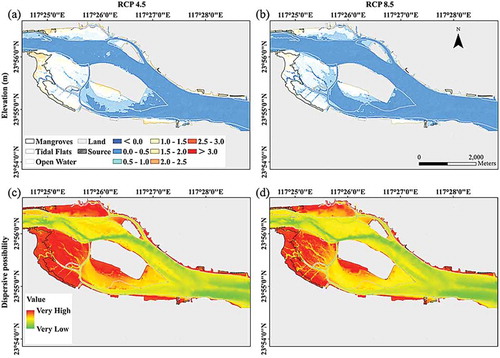
Figure 6. Prediction of sediment elevation in 2100 under the mean sea-level rise of (a) the IPCC RCP 4.5 and (b) RCP 8.5 scenarios and the potential S. apetala seedling dispersal under (c) the RCP 4.5 and (d) RCP 8.5 scenarios in Zhangjiang Estuary.