Figures & data
Figure 1. Fault tree diagram of environmental risks resulting from intensive arable land use.
Figure 2. The locations of the study areas – – Shandong Province and the Dongting Lake Region.
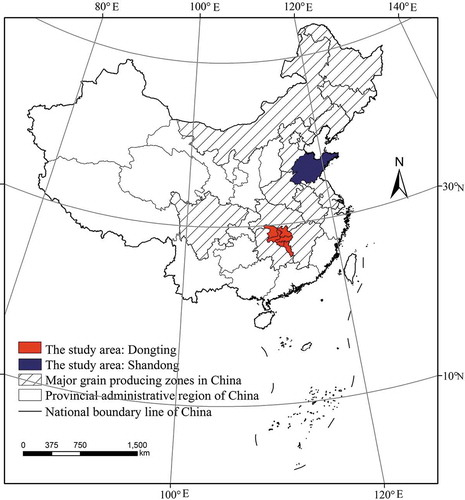
Figure 3. Pollutant discharge from arable land use in the Dongting Lake Region and Shandong Province.
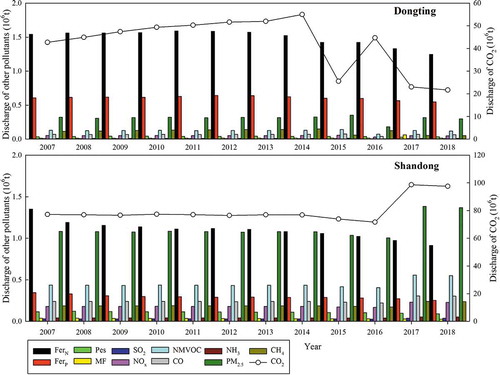
Figure 4. Distribution of pollutants in the Dongting Lake Region in 2007 and 2018.
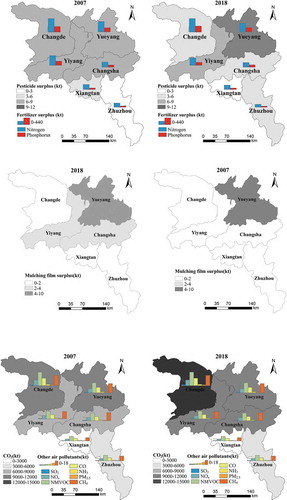
Table 3. Cumulative discharges for cities of the Dongting Lake Region from 2007 to 2018 (unit: 103 t).
Figure 5. Distribution of pollutants in Shandong Province in 2007 and 2018.
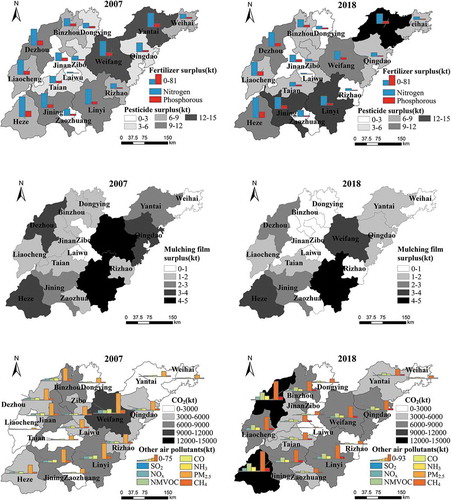
Table 4. Cumulative discharge in cities of Shandong from 2007 to 2018 (unit: 103 t).
Figure 6. Pollutants discharged per unit of arable land area attributable to five forms of environmental risk.
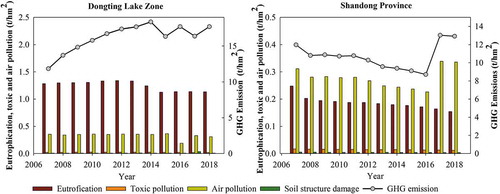
Figure 7. Long-term changes in environmental risk among cities in the Dongting Lake Region.
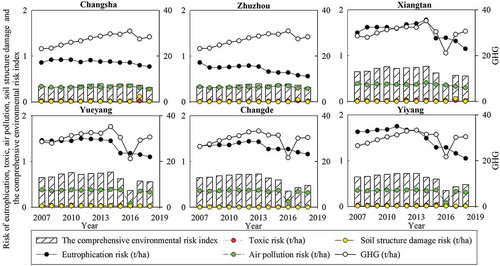
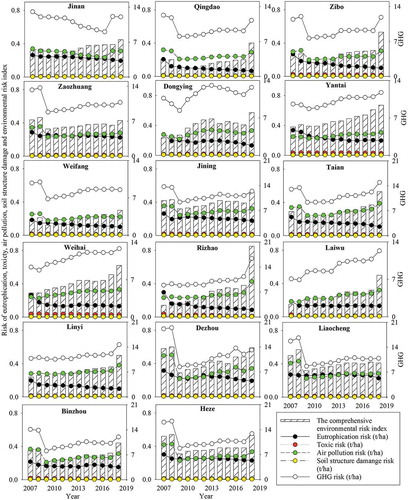
Figure 8. Long-term changes in environmental risk among cities in Shandong Province.