
Figures & data
Figure 1. Harvest control rule for NPFMC Tier 3 stocks where F35% is considered a proxy for FMSY showing the buffer between the ABC and OFL, and how fishing mortality is ramped downwards as stock size declines.
Table 1. Risk classification table for assessment, population dynamics, and environmental/ecosystem considerations.
Figure 2. Flow of ecosystem information in NPFMC annual harvest specification process. Risk tables are produced for each stock assessment using information from both the ecosystem-level ecosystem status report (ESR) and from the stock-specific ecosystem and socio-economic profiles (ESP).
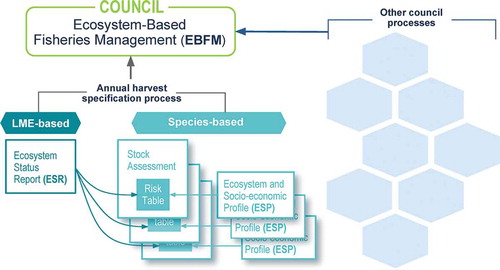
Table 2. Risk table evaluation for Gulf of Alaska pollock in the 2018 stock assessment.