
Figures & data
Figure 1. Study area
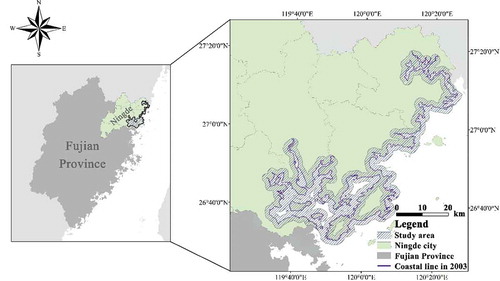
Figure 2. Procedures of Ningde coastal region land use and land cover classification
Table 1. Description of landscape metrics
Table 2. Dynamics of landscape changes during 2003–2010 and 2010–2016
Figure 3. Land use/cover of the Ningde coastal region in 2003 (left), 2010 (middle), and 2016 (right)
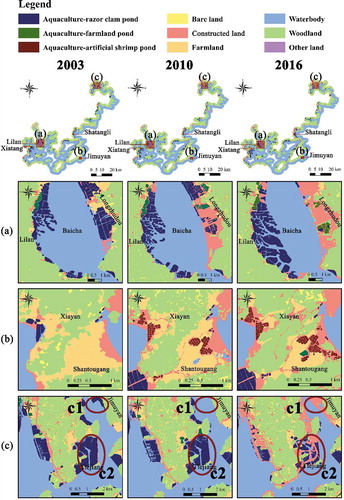
Figure 4. Types of coastal aquaculture in Ningde coastal region between 2003 and 2016. Razor clam: in blue color; farmland pond: in green color, and artificial shrimp pond: in red color
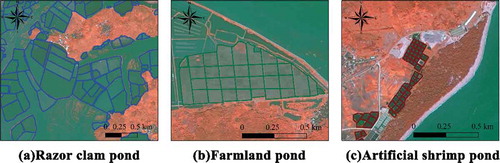
Figure 5. Transfer flows of different land use types between 2003–2010 and 2010–2016. See details in Appendices F and G
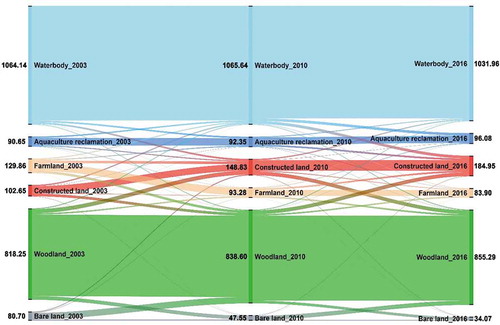
Table 3. Landscape pattern metrics of the coastal aquaculture area and the entire Ningde coastal region
Table 4. Descriptive statistics of variables used in the regression model
Table 5. Coefficients of factors that are associated with coastal aquaculture area changes