Figures & data
Figure 1. Regional contributions to anthropogenic emissions of nitrogen oxides (NOx) and non-methane volatile organic compounds (NMVOCs) as of 1990 and 2014. Data were extracted from Hoesly et al. (Citation2018). NOx emissions are expressed on NO2 basis. NMVOCs do not include biogenic VOCs (BVOCs)
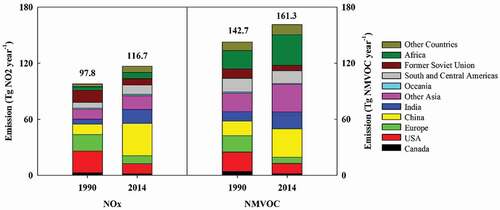
Figure 2. Plant responses to ozone at various scales. ASA: reduced ascorbate; Asc/Glu: ascorbate/glutathione cycle; PS: photosynthesis; Metab. Ir and IIr: primary and secondary metabolites; ROS: reactive oxygen species, e.g., H2O2, OH.
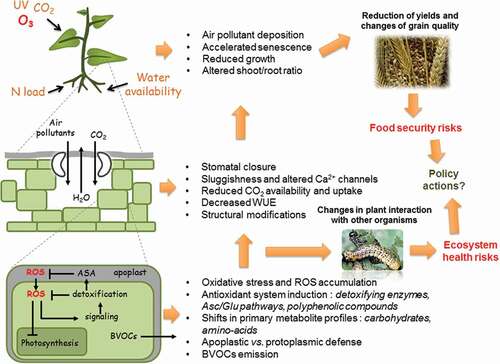
Figure 3. Emissions of biogenic volatile organic compounds (BVOCs) in China at national level as estimated by various studies. ISO: isoprene, MONs: monoterpenes, OVOCs: other BVOCs. Anthropogenic emissions of non-methane VOCs (NMVOCs) are also shown by the range of estimates for years from 2004 onward. References are arranged in chronological order of publication from the left to the right. MONs and OVOCs are combined in the reference 10. See Table S1 for details
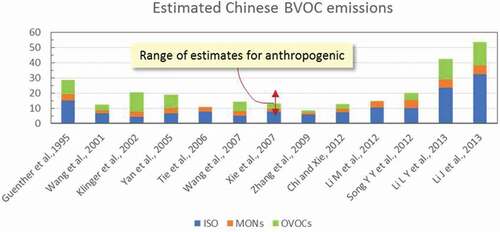
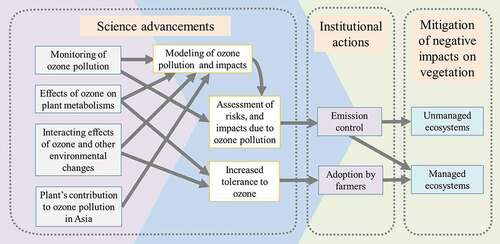
Figure 4. Structure of challenges in order to reduce ozone impacts on vegetation in Asia