
Figures & data
Figure 1. Spatial distribution of fishing effort of Sthenoteuthis oualaniensis in the South China Sea from spring to winter during 2014–2017. The region within the red rectangular box is our study area
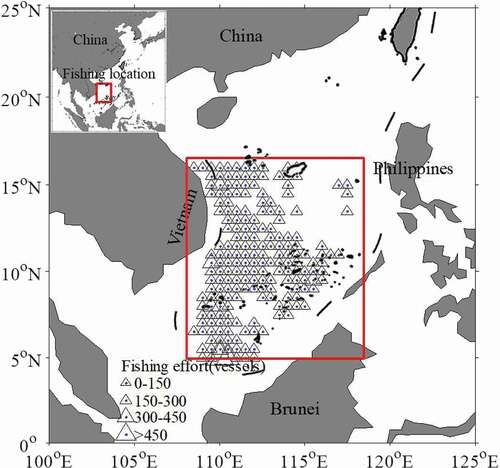
Figure 2. Seasonally spatial distribution of averaged sea surface temperature (SST), Chlorophyll-a (Chla) and sea surface height (SSH) on the fishing ground of Sthenoteuthis oualaniensis in the South China Sea from spring to winter during 2014–2017
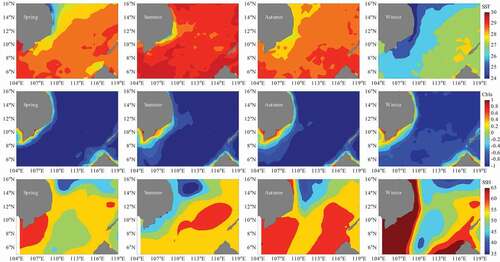
Figure 3. Seasonal fitted suitability index (SI) curves inferred from the associations between fishing effort and sea surface temperature (SST), Chlorophyll-a (Chla) concentration and sea surface height (SSH) from spring to autumn over 2014–2016
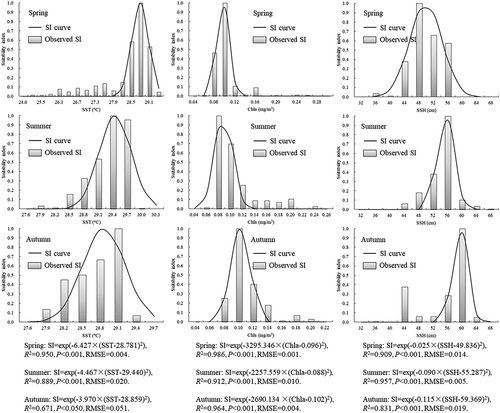
Figure 4. The percentage of fishing occurrence and number of grids under each habitat suitability index (HSI) class interval from spring to winter using data during 2014–2016
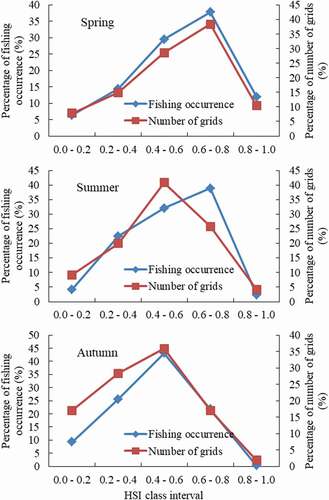
Figure 5. Spatial distribution of habitat suitability index (HSI) on the fishing ground of Sthenoteuthis oualaniensis overlain with the fishing efforts from spring to autumn in 2017 in the South China Sea
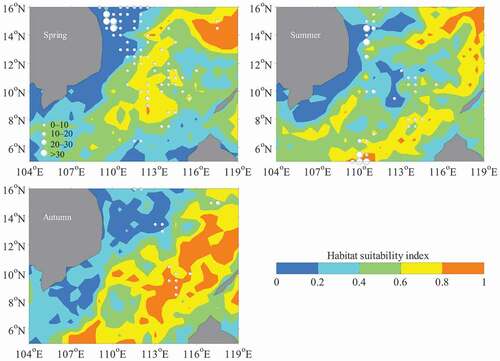
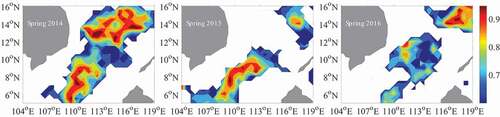
Figure 6. Seasonal distribution of the average habitat suitability index (HSI) on the fishing ground of Sthenoteuthis oualaniensis in the South China Sea from spring to autumn during 2014–2017
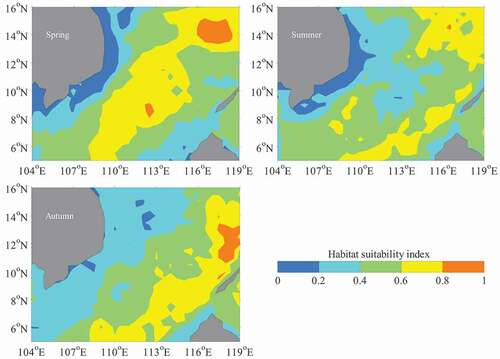
Figure 7. The occurrence of suitable habitats (HSI>0.6) of Sthenoteuthis oualaniensis in the South China Sea from spring to autumn during 2014–2017 in relation to the latitude (Upper panel) and longitude (Lower panel)
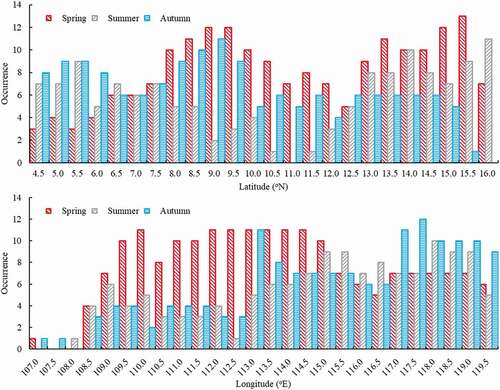
Figure 8. Seasonal contour maps of SI_SST>0.6 (suitability index of sea surface temperature (SI_SST) higher than 0.6) overlain with the contour lines of SI_Chla>0.6 (suitability index of Chlorophyll-a (SI_Chla) higher than 0.6) and SI_SSH>0.6 (suitability index of sea surface height (SI_SSH) higher than 0.6) on the fishing ground of Sthenoteuthis oualaniensis from spring to autumn in the South China Sea
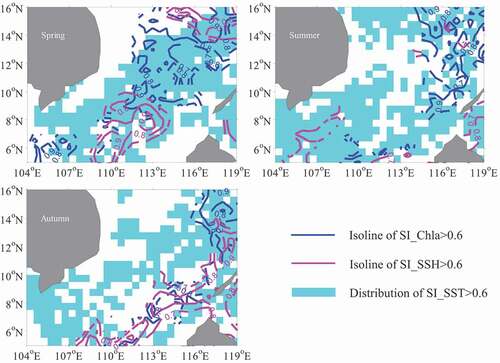
Figure 9. Seasonally spatial distribution of correlation coefficients between the habitat suitability index (HSI) on the fishing ground of Sthenoteuthis oualaniensis and sea surface temperature (SST), Chlorophyll-a (Chla) concentration and sea surface height (SSH), respectively, from spring to autumn in the South China Sea
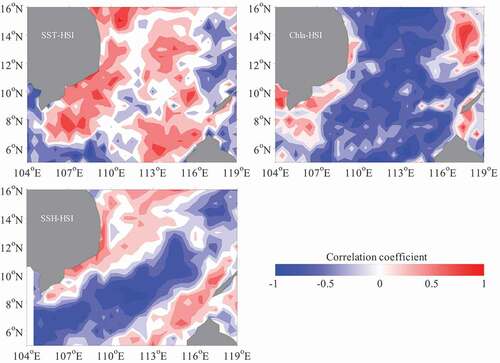
Figure 10. Differences in sea surface temperature (SST) (Uppper panel), Chlorophyll-a (Chla) concentration (Middel panel) and sea surface height (SSH) (Lower paner) between 2014 and 2015 in spring (Left panel), and between 2014 and 2016 in spring (Right panel)
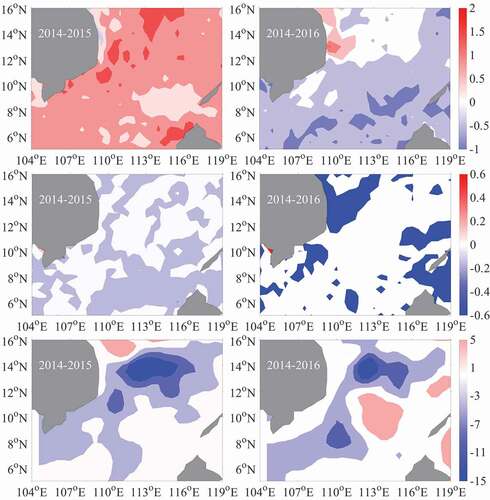
Figure 11. Suitable ranges of sea surface temperature (SST), Chlorophyll-a (Chla) concentration and sea surface height (SSH) for Sthenoteuthis oualaniensis in spring 2014 (the year with normal climate condition), 2015 (the El Niño year with very strong intensity) and 2016 (the El Niño year with weak intensity), based on the suitability index higher than 0.6
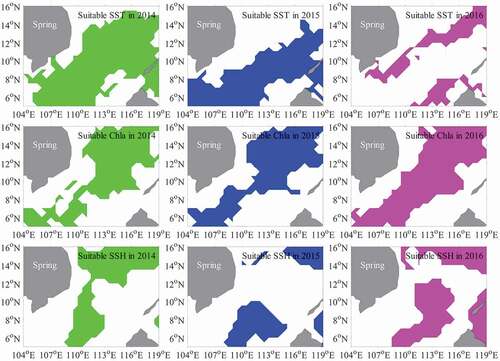
Figure 12. Spatial distribution of suitable habitat (habitat suitability index higher than 0.6) of Sthenoteuthis oualaniensis in spring 2014 (the year with normal climate condition), 2015 (the El Niño year with very strong intensity) and 2016 (the El Niño year with weak intensity) in the South China Sea
Data availability statement
Data available on request from the authors.