
Figures & data
Figure 1. Site map and landscape of the Eten wetland. Doted lines in yellow indicate geomorphic settings along the river corridor, and blue lines indicate river stream and flow. F and G show sampling zones distribution
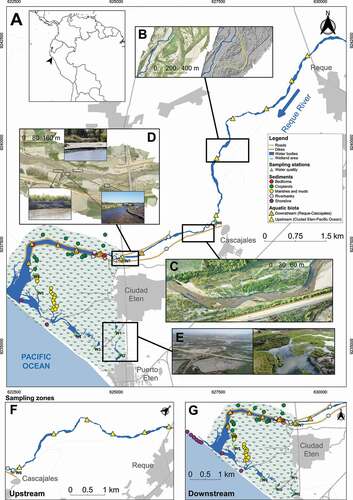
Figure 2. Components of the methodology approach to assess environmental impacts in coastal wetlands based on a hydrogeomorphic classification and environmental characterization
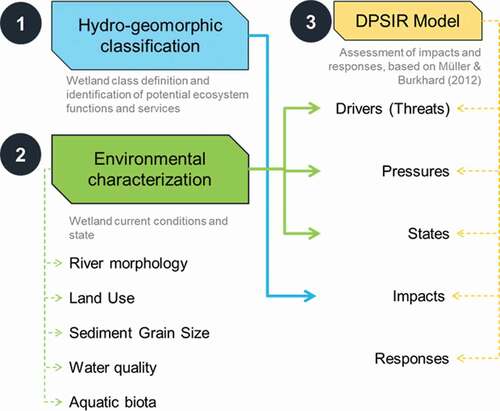
Table 1. Summary of ecosystem services and values of the Eten wetland. Photographs were taken during field visits and data collection
Figure 3. Landscape condition along the Reque River. Satellite image obtained from Google Earth. From 1 to 10, photographs illustrate a variety of geomorphic settings (both in land and alluvial channel), presence of migratory birds, waste disposal, soil salinization, and river infrastructure
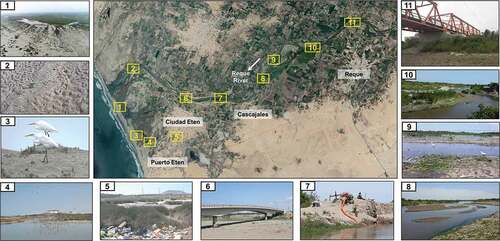
Figure 4. Changes in land use and river morphology in the Eten wetland from 1949 to 2019. Graphs indicated maximum annual extension of water and cropland areas
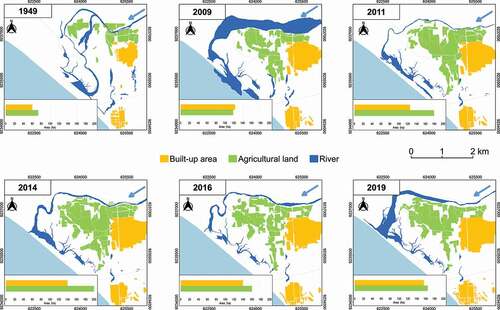
Figure 5. Average particle size distribution and mean grain size (d50) of sediments within the Eten wetland. Photographs illustrate sampling sites
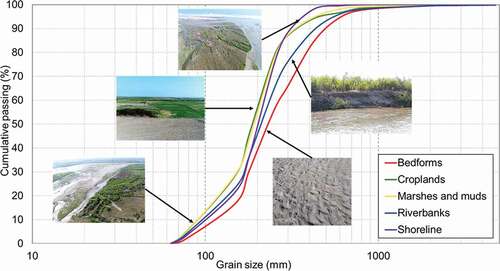
Table 2. Physical-chemical parameters at the sampling stations in the Eten wetland (single measurement)
Figure 6. Relative abundance of the macroinvertebrate community sampled downstream (orange) and upstream (yellow) the Eten wetland. Photographs on the left side show some individuals found
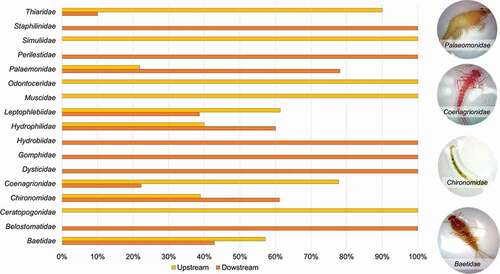
Table 3. Application of the DPSIR model to human-nature system of the Eten wetland