Figures & data
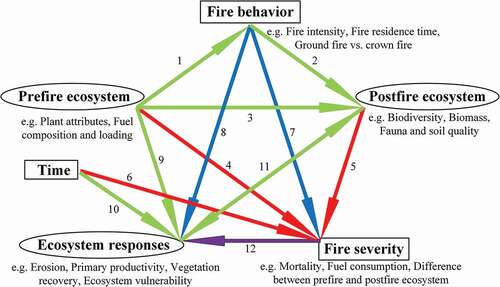
Figure 1. Examples of 2001 Hoover fire severity classes (van Wagtendonk, Root, and Key Citation2004), a, unburned; b, high; c, moderate; d, light
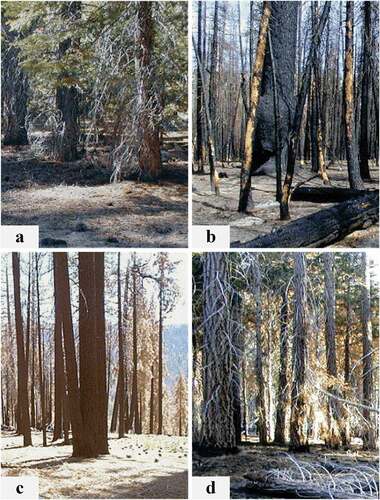
Table 1. Canopy-severity index and their characteristics descriptions
Table 2. General forest fire severity classes and their characteristics descriptions, summarized and modified from (Keeley Citation2009; Ryan Citation2002; Ryan and Noste Citation1985; Turner et al. Citation1994)
Figure 2. Simplified composite burn index (CBI) field data form
Table 3. Common remote sensing indices for quantifying fire severity
Figure 3. Conceptual model for fire severity measuring. Ellipse indicates latent variable; rectangle indicates manifest variable. Besides, green lines indicate respective relationships that are significant but restricted/ non-unique; purple lines indicate relationships that we expect to recognize; red lines indicate relationships that must be utilized, which are the cornerstones of all fire severity measurement methods; blue lines indicate relationships that are difficult to be observed or exploited