
Figures & data
Figure 1. The development of economic compensation policies for cultivated land protection in China.
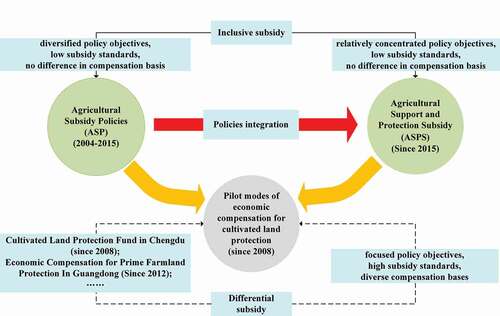
Table 1. Four pilot economic incentive schemes for cultivated land protection in China
Figure 2. Research framework of this study.
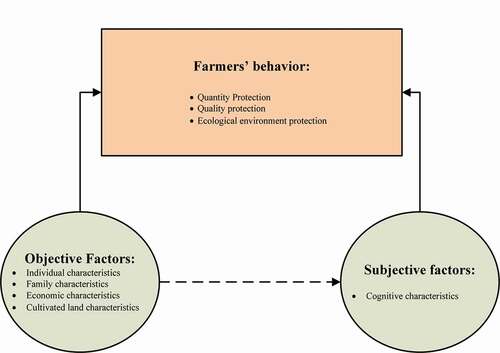
Figure 3. General situation in the study area and the distribution of samples.
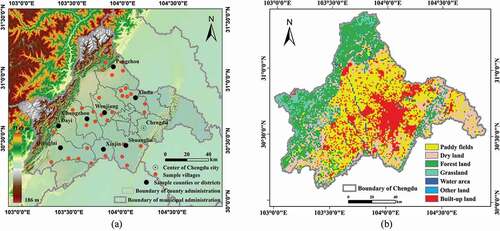
Figure 4. Descriptive statistics of the variables of farmers’ characteristics.
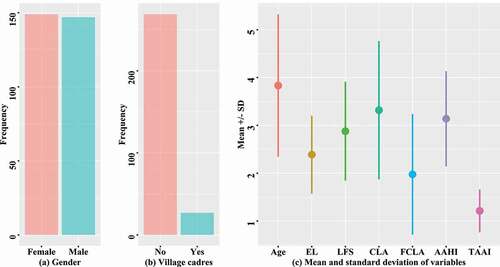
Figure 5. Descriptive statistics of farmers’ understanding of the CLPF.
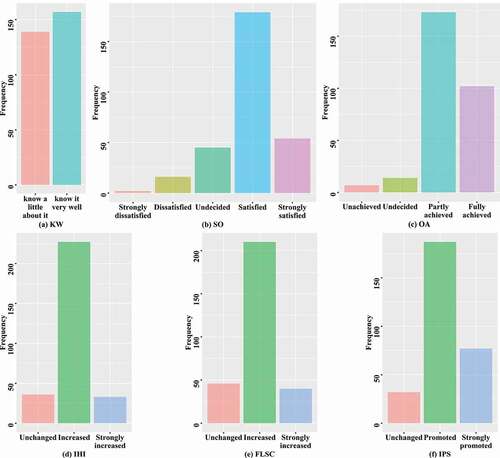
Figure 6. Distribution of farmers’ behavior toward participating in the CLPF.
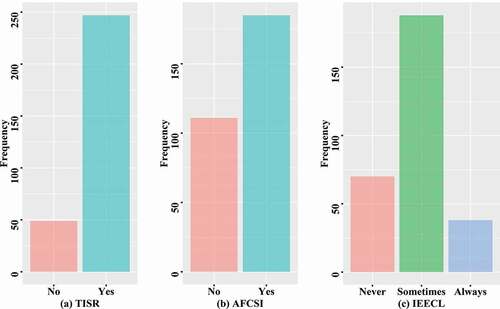
Table 2. Correlation between farmers’ behavior and the influencing factors
Table 3. Path coefficients between farmers’ behavior in farmland quantity protection and the influencing factors
Table 4. Path coefficients between farmers’ behavior in farmland ecological environment protection and the influencing factors
Table 5. Path coefficients between farmers’ behavior in farmland quality protection and the influencing factors