Figures & data
Figure 1. Location of the study area.
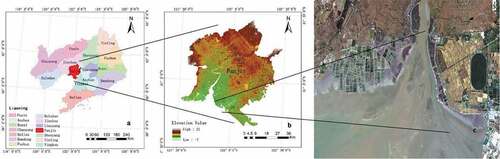
Figure 2. Changes in soil water content in different degraded areas.
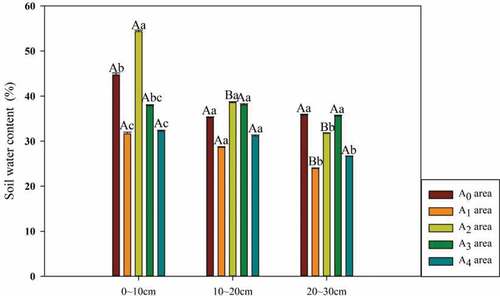
Figure 3. Particle size distribution in the different degraded areas.
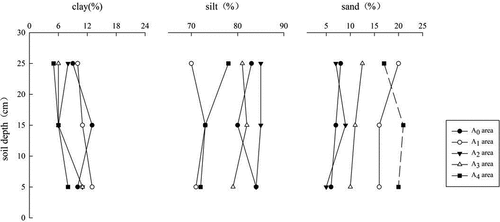
Figure 4. Soil total salt content in the different degradation areas.
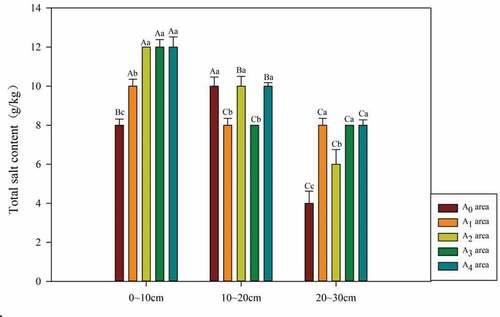
Figure 5. Soil salt ion concentration in different degraded areas.
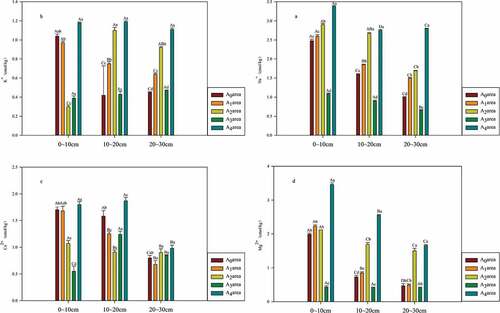
Figure 6. Soil pH in different degraded areas.
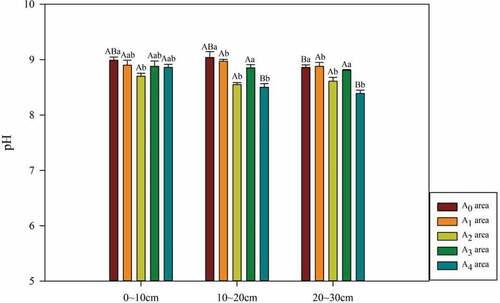
Figure 7. Changes in available soil nutrient concentration in different degraded areas.
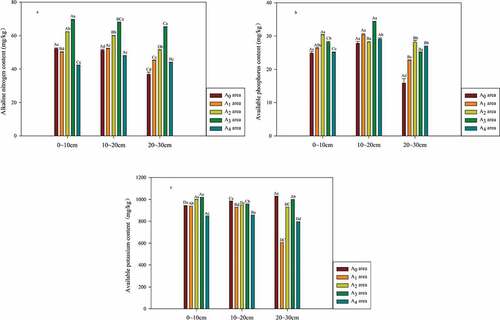
Figure 8. Soil organic matter content in the different degradation areas.
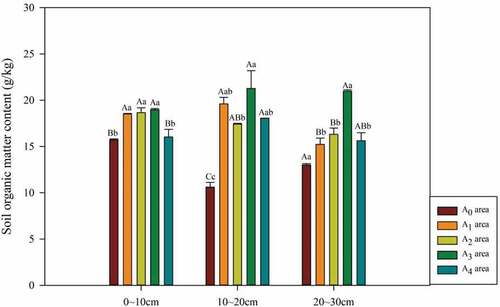
Table 1. Correlation analysis of plant properties of Suaeda salsa.
Table 2. Correlation between Suaeda salsa biomass and soil physicochemical properties.
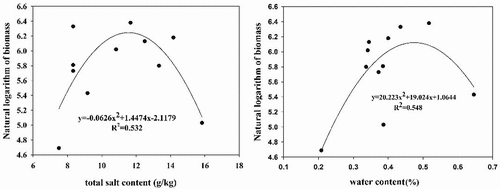
Figure 9. Quadratic curve fitting of Suaeda salsa biomass with soil water content and total salt content.