Figures & data
Figure 1. Map of Damao County.
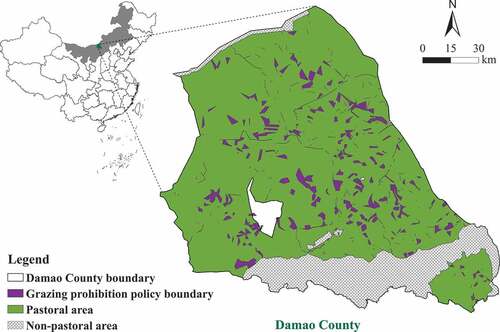
Table 1. General information of the PES program in damao county
Figure 2. Grassland conditions of Damao County under differet payment standards.
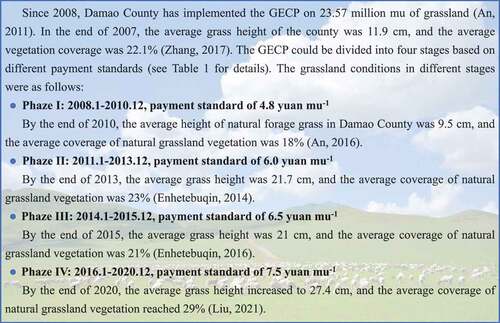
Table 2. Descriptive statistics of variables used in the model
Table 3. Descriptive statistics of variables for relocated and non-relocated households
Table 4. Estimate of conservation payments and other characteristics and their marginal effects on the grazing households’ response
Figure 3. Response curve of non-grazing ratios and payments. 1 ha = 15 mu.
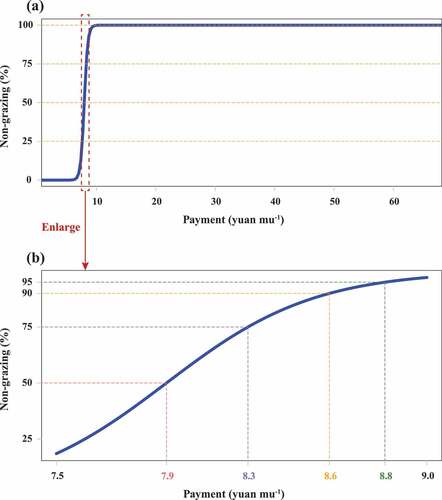
Figure 4. Maps of the spatial configuration of probability of non-grazing under different conservation payments in Damao County, China (a: 70% of current payment; b: 100% of current payment; c: 130% of current payment; d: 150% of current payment).
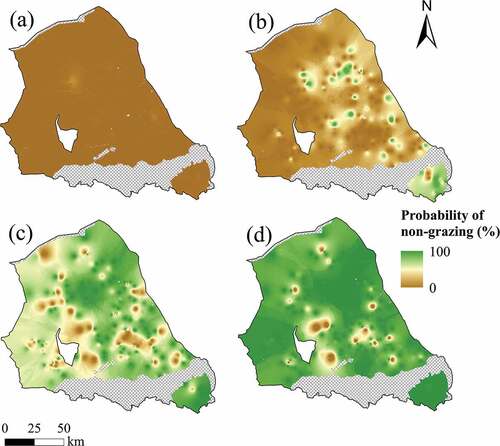
Figure 5. Maps of the spatial configuration of predicted conservation payment which herders expect for under different probability scenarios in Damao County (a: probability = 50%; b: probability = 75%; c: probability = 90%; d: probability = 95%). 1 ha = 15 mu.
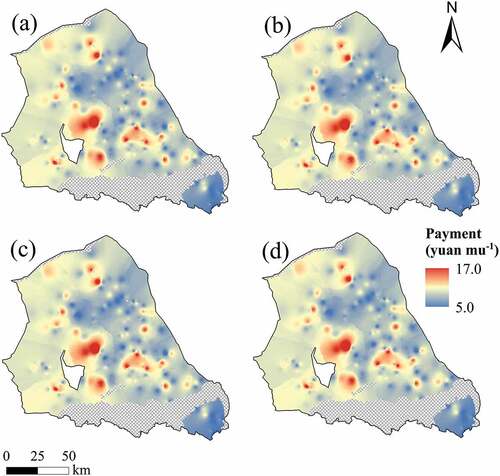
Figure 6. Distribution map of annual herding income of herders in Damao County.
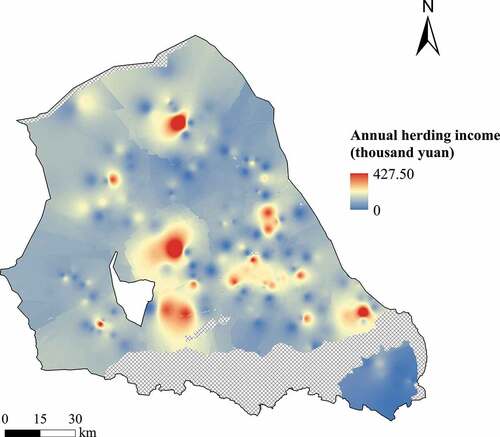
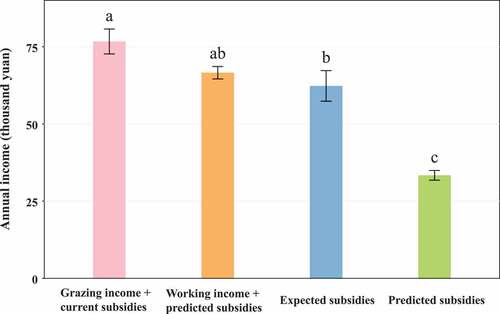
Figure 7. Bar graph of significant differences in annual income of different types (pink: sum of actual annual grazing income and current annual subsidies; Orange: sum of the annual subsidies predicted by the model (probability = 95%) and the income from working outside (monthly minimum wage in Inner Mongolia implemented in 2017, the fourth level is 1460 yuan per month, Ministry of Human Resources and Social Security of China); blue: annual subsidies expected by herders in the questionnaires; green: annual subsidies predicted by the model (probability = 95%)).