
Figures & data
Table 1. Information about the ten countries.
Figure 1. Trends in CO2 emissions of major countries from 1965 to 2019 (Data source: IEA, and this study).
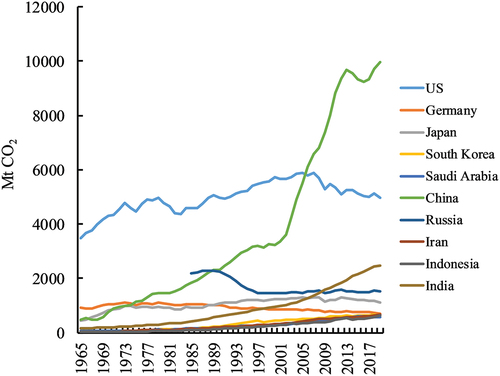
Figure 2. The cumulative CO2 emission per capita by country from 1965 to 2019.
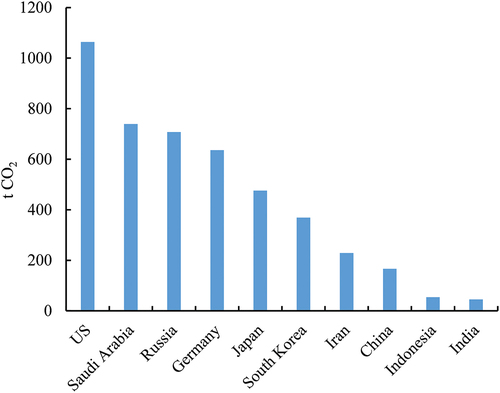
Figure 3. Driving mechanisms of carbon emission for major countries in the world from 1965 to 2019.
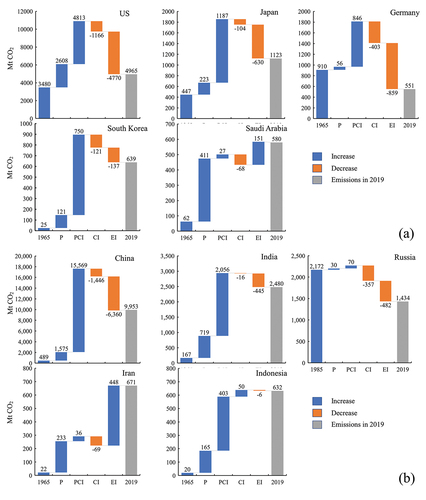
Figure 4. Temporal changes in driving mechanisms of CO2 emissions.
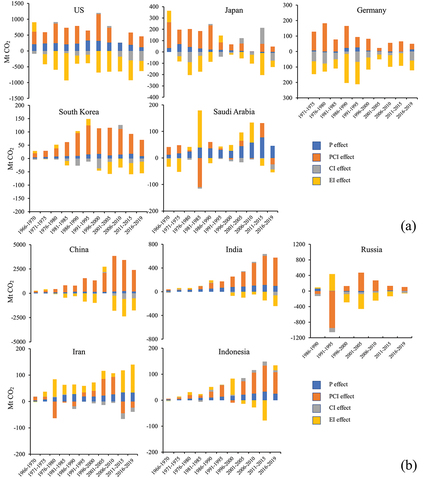
Figure 5. Driving mechanism of CO2 emissions at the global level from 1965 to 2020.
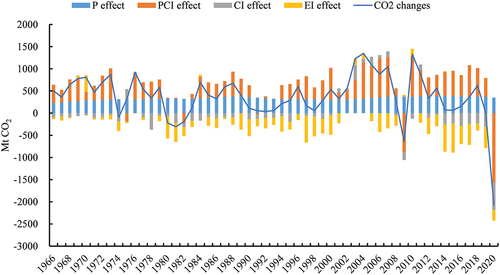
Table 2. Group regression results of STIRPAT model for sampled countries.
Figure 6. The CO2 emissions projection for high-income countries from 1960 to 2030. Green and yellow scatter denotes observation and estimation of emissions, the curve represents fitted values of estimation, and the shaded area represents the 95% confidence interval of estimation.
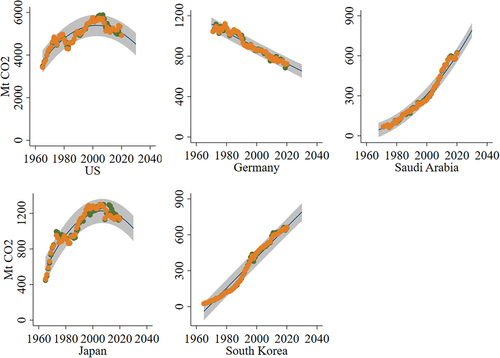
Figure 7. The CO2 emissions projection for middle and low-income countries from 1960 to 2030. Green and yellow scatter denotes observation and estimation of emissions, the curve represents fitted values of estimation, and the shaded area represents the 95% confidence interval of estimation.
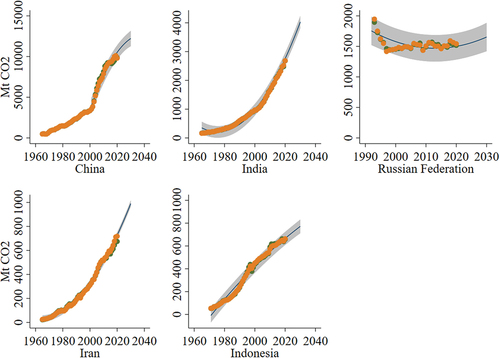
Table 3. Decoupling index of carbon emission and economic development.
Supplemental Material
Download MS Word (15.7 KB)Data availability statement
The data that supports the findings of this study are available from the corresponding author, Lu, Y. L., upon reasonable request.