Figures & data
Figure 1. Location and elevation of the study area.
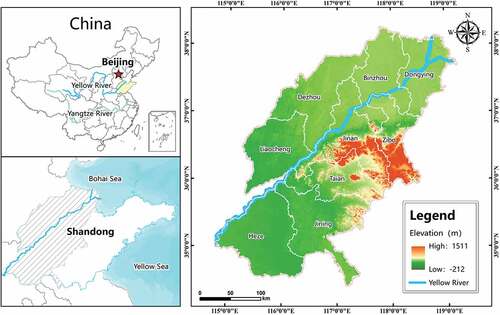
Figure 2. The research framework of this paper.
Table 1. The weights and maximum influence distances of threat sources.
Table 2. Sensitivity of different habitats types to different threat factors.
Figure 3. Results of MSPA and habitat quality evaluation. (a) MSPA results; (b) habitat quality evaluation results.
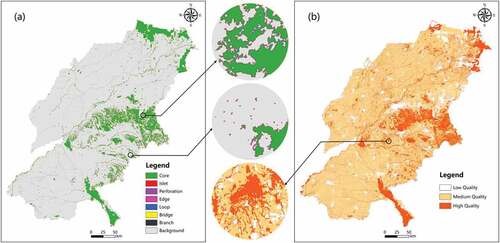
Figure 4. Spatial distribution of ecological sources and ecological resistance surfaces.
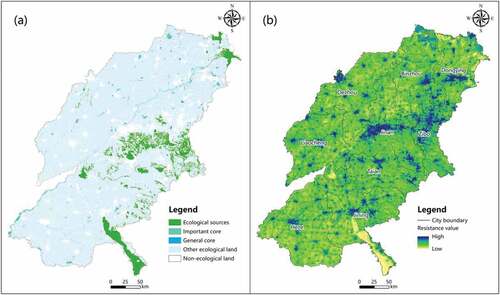
Figure 5. Regional ecological network. (a) Before optimization, (b) after optimization.
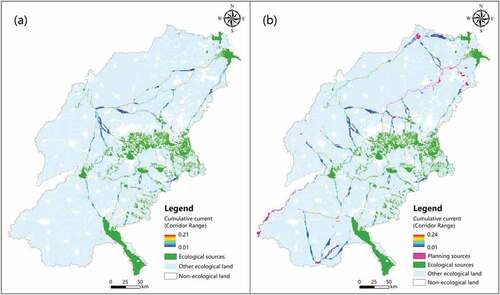
Figure 6. Distribution of priority areas for protection and restoration.
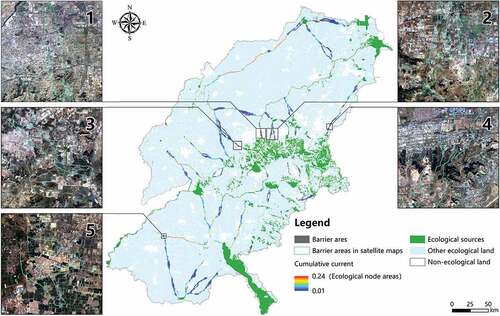
Figure 7. Comparison of MSPA results under different edge effects.
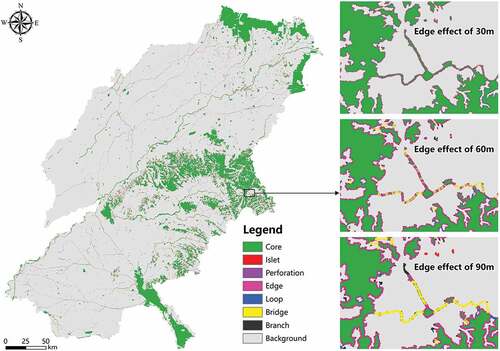
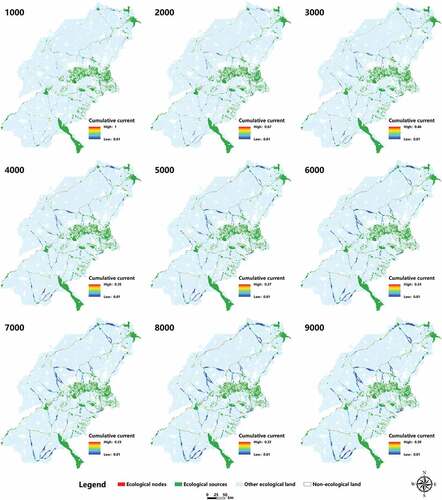
Figure 8. Variation in the ecological corridor range and cumulative current at thresholds of 1000–9000.