Figures & data
Table 1. Framework of the supply table.
Table 2. Framework of the use table.
Table 3. Framework of the physical input-output table.
Figure 1. China’s P emissions to the environment (including air, land, water, and sea) from the supply perspective during 1949–2012.
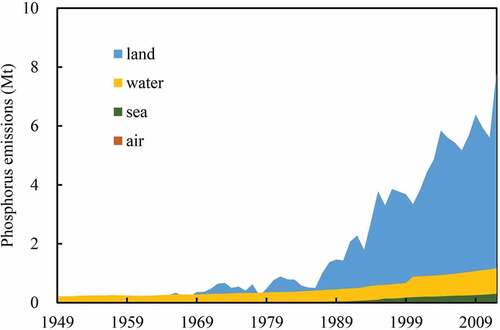
Figure 2. Production perspective and supply perspective P emissions of products in China in 2012. The percentages in the figure indicate P emissions from products as a percentage of total P emissions from the two perspectives.
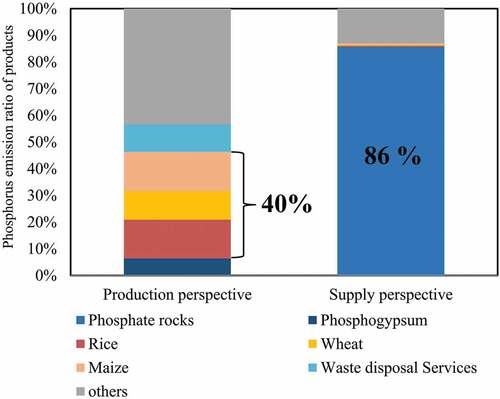
Figure 3. Supply-side P emissions of the phosphate rocks during 1949–2012.
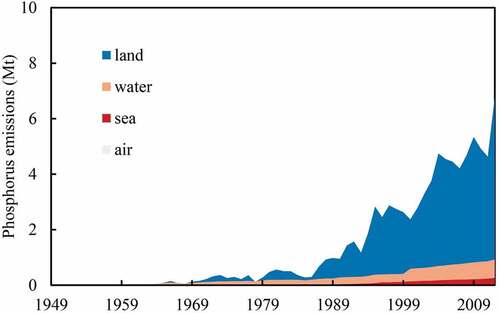
Figure 4. Comparison of the trends in supply-side P emissions of products in China during 1949–2012. The gray lines in the figure represent other products such as excreta from poultry, pigs and maize.
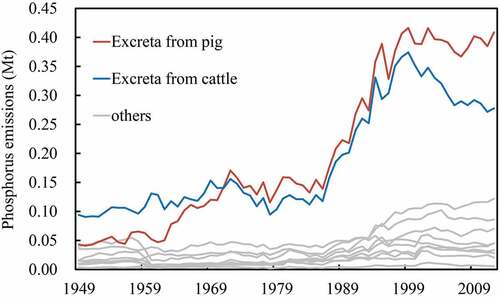
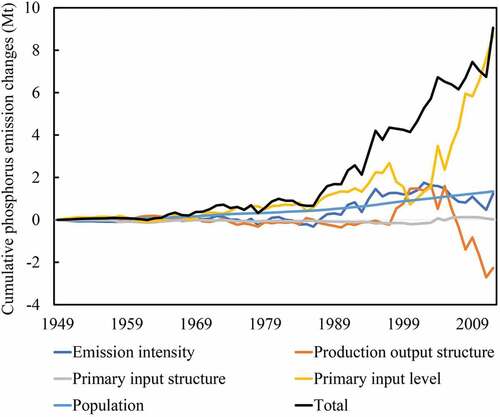
Figure 5. Relative contributions of socioeconomic factors to China’s P emission changes during different time periods from the supply perspective.
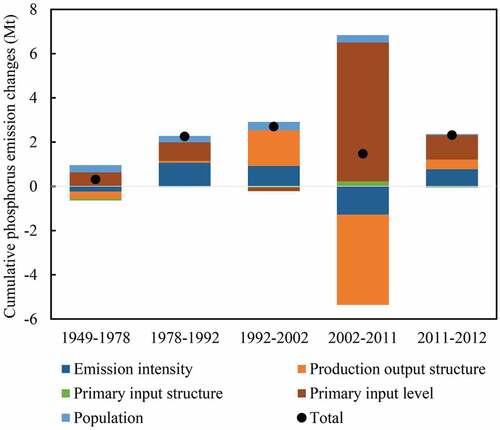
Figure 6. Relative contributions of socioeconomic factors to China’s P emission changes from the supply perspective during 1949–2012.