Figures & data
Figure 1. The location of Chifeng, China.
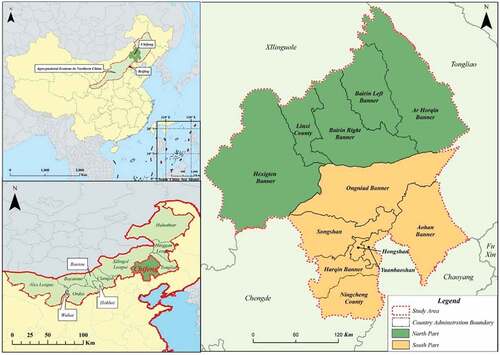
Table 1. Statistical data of social and economic of north and south in chifeng (2018).
Figure 2. Analysis framework of distinct land use pattern impacts on regional ESs in the typical agro-pastoral ecotone of northern China.
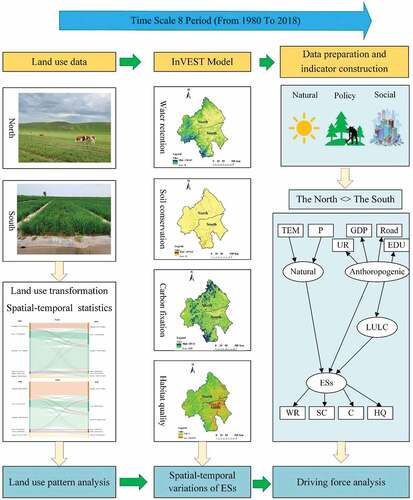
Table 2. Principal data sources in this study (InVEST sub-models: WY = water yield model, SDR = sediment delivery ratio model, C = carbon model, HQ = habitat quality).
Figure 3. Influence mechanism of spatial-temporal evolution of ESs in Chifeng.
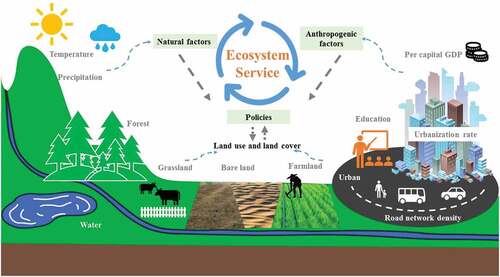
Table 3. The descriptions of each factor in the structural equation modeling.
Figure 4. Land use transfer matrix in the different regions of Chifeng.
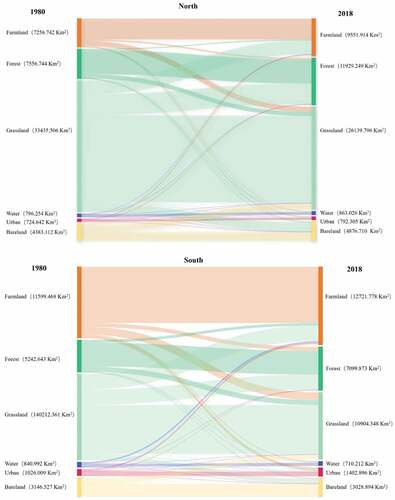
Figure 5. The multi-year average spatial distribution map and change trend map of water retention in the different regions of Chifeng from 1980 to 2018.
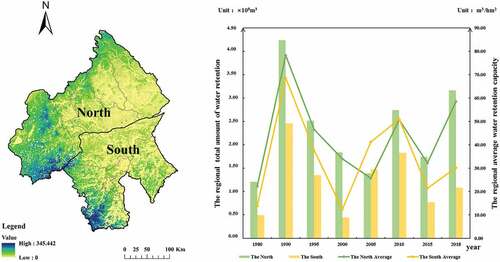
Figure 6. The multi-year average spatial distribution map and change trend map of soil conservation in the different regions of Chifeng from 1980 to 2018.
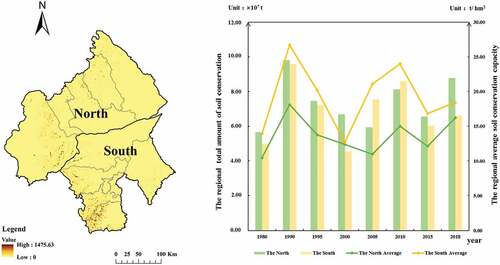
Figure 7. The multi-year average spatial distribution map and change trend map of carbon fixation in the different regions of Chifeng from 1980 to 2018.
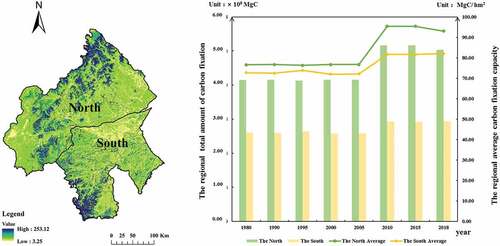
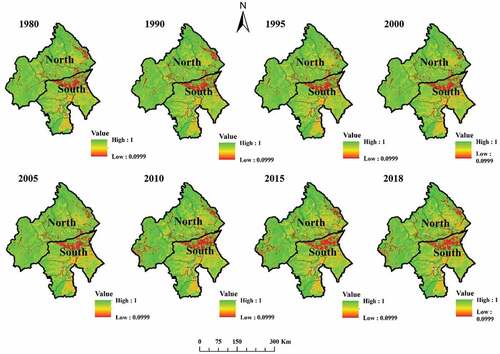
Figure 8. The multi-year average spatial distribution map and change trend map of habitat quality in the different regions of Chifeng from 1980 to 2018.
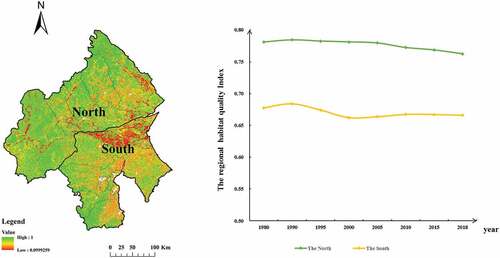
Figure 9. Structural equation modeling of the different regions of Chifeng (a: North, b: South) (probability: p < 0.001: ***; p < 0.01: **; p < 0.05: *).
Figure A1. Land use and land cover change in the different regions of Chifeng.
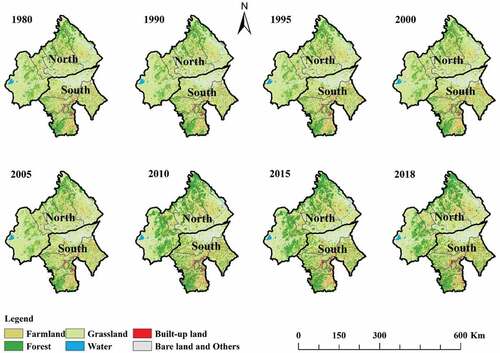
Figure A2. Spatial distribution of water retention in the different regions of Chifeng.
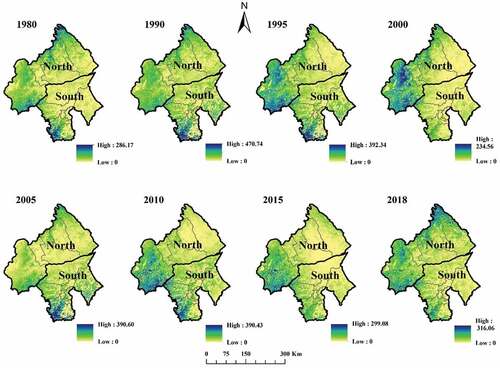
Figure A3. Spatial distribution of soil conservation in the different regions of Chifeng.
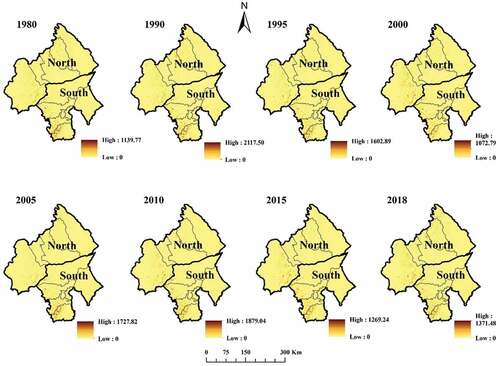
Figure A4. Spatial distribution of carbon fixation in the different regions of Chifeng.
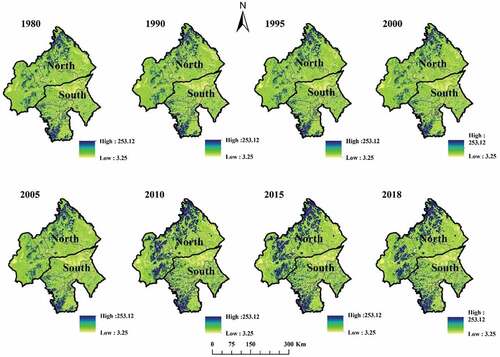
Figure A5. Spatial distribution of habitat quality in the different regions of Chifeng.