Figures & data
Figure 1. Location of the study area. The colored points are emergence sites of G nigricollis. (a) shows the distribution of species points, (b), (c) and (d) are photographs of G nigricollis in the field.
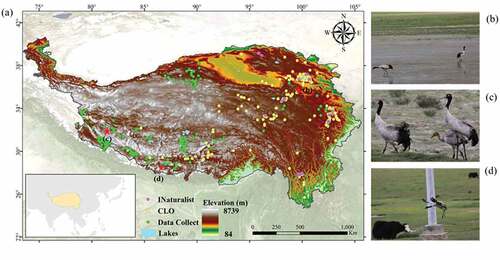
Table 1. Descriptions of the different analyzed SSP scenarios (O’Neill et al. Citation2016; You et al. Citation2021).
Figure 2. Simple descriptions of the technological processes in this study.
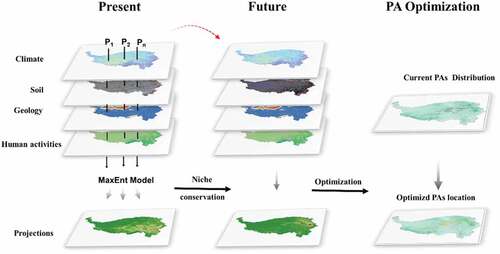
Table 2. List of the 13 selected parameters used in the MaxEnt model.
Table 3. Auc standards used in the evaluation process of the MaxEnt model.
Figure 3. Habitat quality reclassification and regional area statistics of G. nigricollis. The area south of the red line is the overwintering area, and the region north of the red line is the breeding area. This pathway was drawn according to the previous studies of Lhendup & Webb (Lhendup and Webb Citation2009), Wang et al. (Wang, Mi, and Guo Citation2020), and IUCN (IUCN Citation2020).
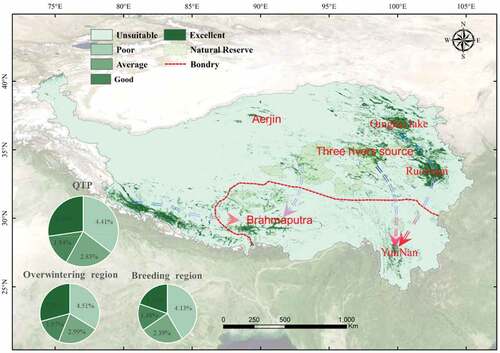
Figure 4. Habitat distribution changes and statistics of habitat area changes in overwintering and breeding regions of G. nigricollis during 2040–2100 under the four future climate change scenarios, including SSP1–2.6(a-d), SSP2–4.5(e-h), SSP3–7.0(i-l) and SSP5–8.5(m-p).
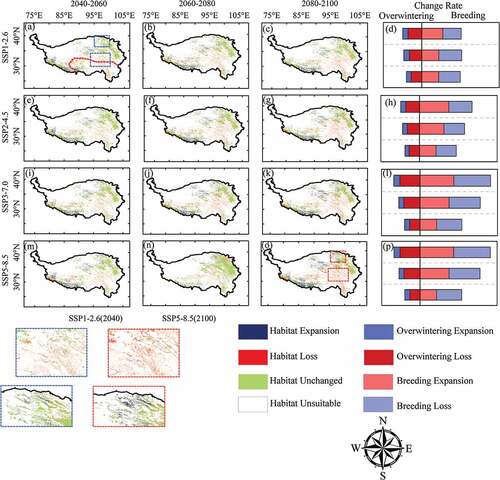
Figure 5. Statistical bars showing habitat quality changes of G. nigricollis under the analyzed future scenarios. Statistical bars showing habitat quality changes under the analyzed future scenarios. (a) SSP1–2.6; (b)SSP2–4.5, (c)SSP3–7.0, (d)SSP5–8.5.
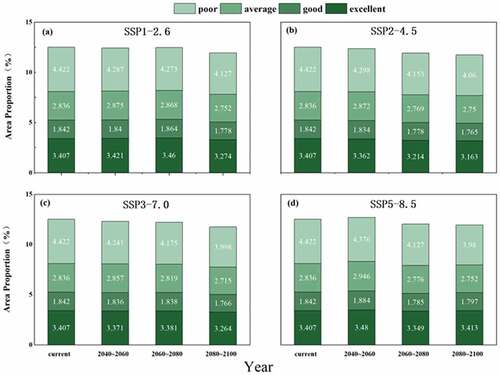
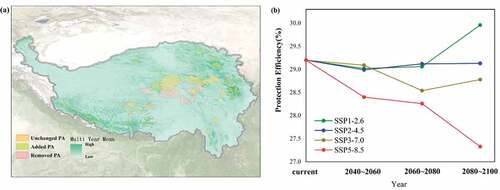
Figure 6. Changes in the current PA efficiency under future climate change scenarios.
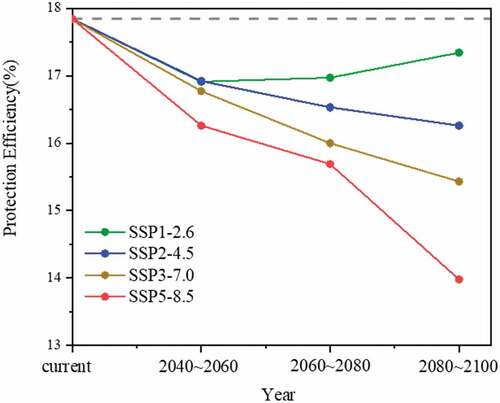
Figure 7. Distribution and efficiency of optimized PAs: (a) PA pattern optimization and adjustment under the condition of no change in the total PAs. (b) changes of optimized PAs efficiency in the future climate scenarios.