Figures & data
Figure 1. Location of the study area (a) and monitoring routes (b).
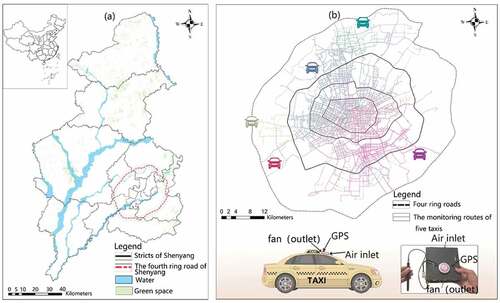
Figure 2. Wind rose (a) and the average particulate matter concentrations (b) in Shenyang during the monitoring period.
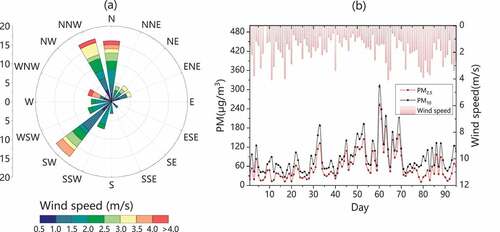
Figure 3. Correlation of the daily average PM value between mobile monitors and national monitoring stations.
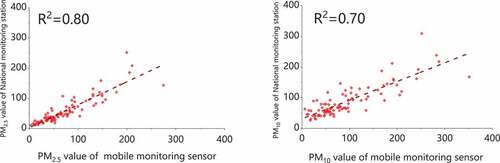
Figure 4. Spatial distribution patterns of PM1 (a), PM2.5 (b), and PM10 (c).
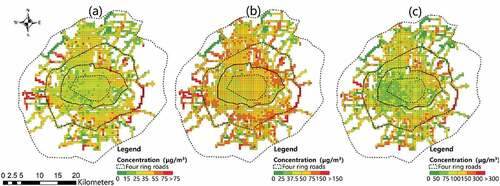
Figure 5. PM concentrations along different road directions under dominant wind directions. (a) N‒NNW wind direction; (b) SW‒WSW wind direction.
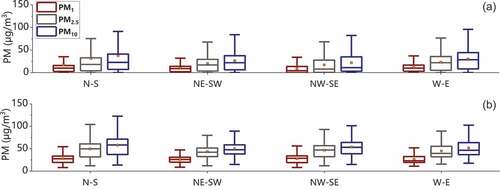
Figure 6. PM concentrations within various ring roads.
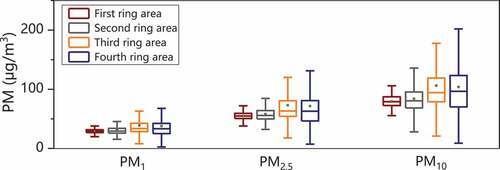
Figure 7. PM concentrations among various urban functional zones. EDZ: educational land zone; BUZ: business zone; AGZ: agricultural zone; GSZ: green space zone; INZ: industrial zone; DEZ: development zone; REZ: residential zone; WAZ: water zone.
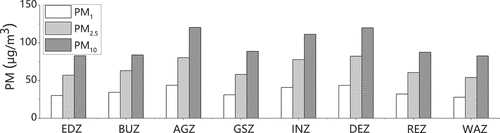
Figure 8. Spatial autocorrelation of PM in the study area. (a) PM1; (b) PM2.5; and (c) PM10.
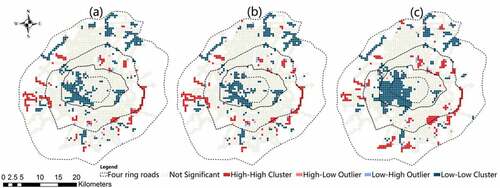
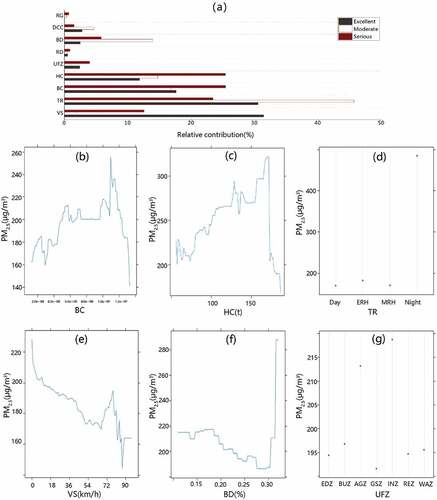
Figure 9. Relative contribution of each factor to PM concentrations (a) and marginal effects of five dominant factors on PM2.5 (b-f). Humi: relative humidity; WD: wind direction; WS: wind speed; Temp: temperature; VS: vehicle speed; TR: time range; BC: betweenness centrality; HC: heating capacity of heating supply companies; UFZ: urban functional zone; RD: road direction; BD: building density; DCC: distance from the city center; RG: road grade.
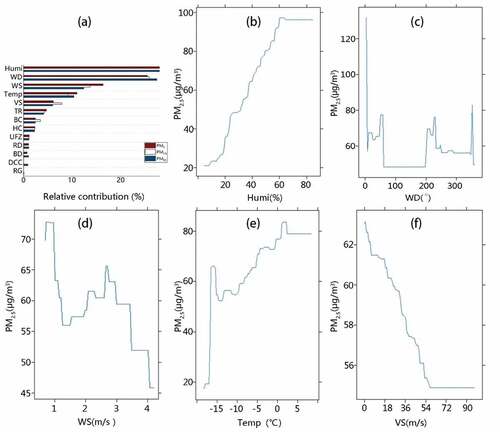
Figure 10. Relative contribution of influencing factors to PM2.5 concentration under three air quality conditions (a) and marginal effects of six dominant factors on PM2.5 under serious pollution (b-g). RG: road grade; DCC: distance from the city center; BD: building density; RD: road direction; UFZ: urban functional zone; HC: heating capacity of heating supply companies; BC: betweenness centrality; TR: time range; VS: vehicle speed.