
Figures & data
Figure 1. Schematic view of the modular and adaptive TimeScan processing chain used to test options of effectively linking users (meaning their software, toolboxes, applications), processing entities and mission archives as a basis to fully exploit the “big data” perspective of modern EO missions).
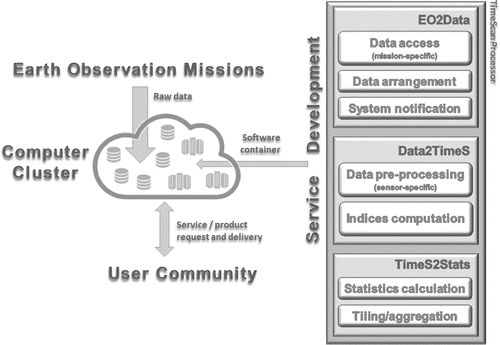
Table 1. List of calculated spectral indices.
Figure 2. Example of the Data2TimeS processing workflow applied to multispectral data including calibration and atmospheric correction (a), masking of clouds (light orange), cloud shadows (light blue), and water (orange) (b), and the calculation of indices for all unmasked pixels of the input image (c).
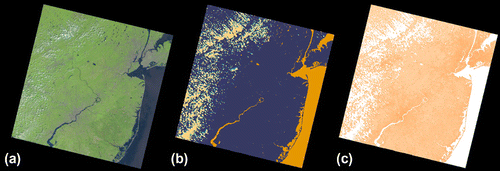
Figure 3. Global TimeScan–Landsat–2015 layer (a) visualized as false colour composite with the temporal mean of the built-up index (NDBI) in red, the vegetation index (NDVI) in green and the water index (MNDWI) in blue, and TimeScan band 31 indicating the total number of valid acquisitions per pixel for the product generation.
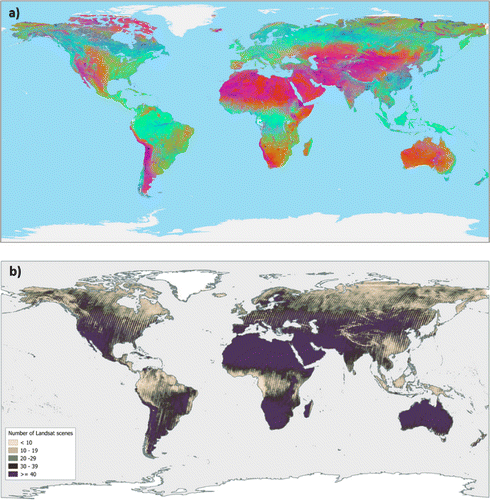
Figure 4. Comparison of single date Landsat–8 scenes (a, d) with corresponding pseudo colour RGB images of the outcome of the TimeScan Data2Stats module (b, c, e, f) which are derived on the basis of all available Landsat–8 images in 2013–2015. The single scenes cover the visible bands whereas the TimeScan layers are composed of the temporal maximum of NDBI, temporal maximum of NDVI, and mean of MNDWI (b, e) and maximum NDVI, mean NDVI and minimum NDVI (f), respectively.
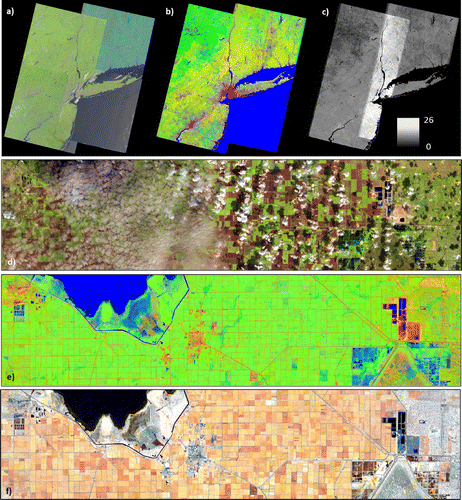
Figure 5. Comparison of TimeScan–Landsat–2015 (a), TimeScan–Sentinel–2–2015 (b), TimeScan–ASAR–2012 (c) and TimeScan–Sentinel–1–2015 (d) for the area of Germany.
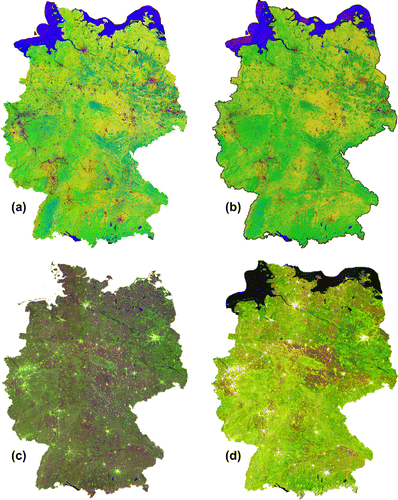
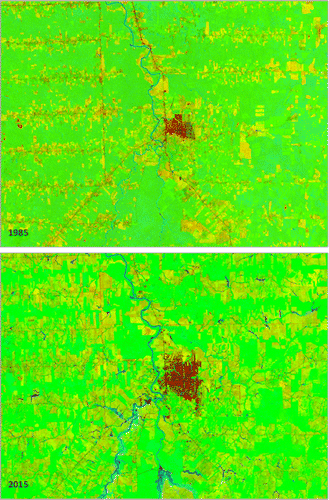
Figure 6. TimeScan–Landsat products of the region around the Brasilian city of Ariquemes, derived from data collected in 1984–1985 and 2013–2015.
Data availability statement
The data referred to in this paper are publicly available in form of a WMS service at https://urban-tep.eo.esa.int.