
Figures & data
Figure 1. The “Silk Road Economic Belt” the Asia-Pacific economic circle in the east and the European economic circle in the west, and the “the 21st-Century Maritime Silk Road” links the major port cities in China and Southeast Asian countries with Europe. It is the longest economic corridor in the world with the high potential. The Belt and Road is composed over 65 countries with a population of 4.4 billion, which is 63% of the world’s population (left), figure adopted from (www.chinadaily.com.cn/bizchina/2014-06/28/content_17621525.htm) PEEX domain (right), figure adopted from the PEEX Science Plan (Lappalainen et al., Citation2014).
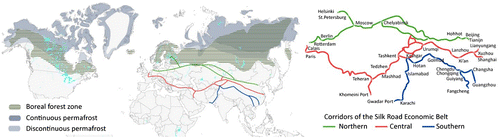
Figure 2. PEEX is interested in and contributing to understanding and quantification of the interlinks and feedbacks of the land-atmosphere-aquatic and society systems relevant to solving grand challenges such as climate change, air quality, food security, and water supply.
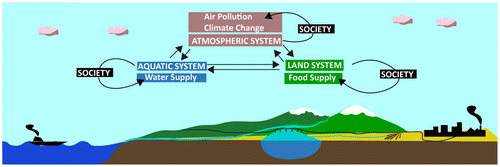
Figure 3. The schematic diagram of the atmospheric chemistry – society – policy-making – infrastructure loop.
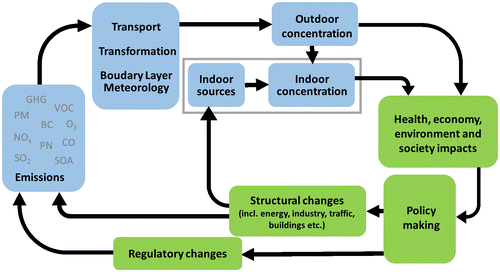
Figure 4. Schematic picture of the interactions and feedbacks between the anthropogenic and biogenic components in the Arctic-boreal area affected by the megacities and industrial areas in China/Russia and consequences for air quality within China/Russia and for the global climate – air quality interactions.
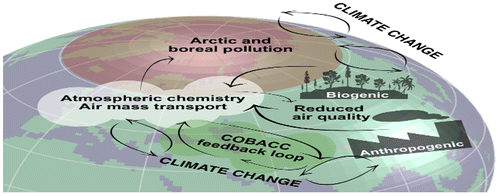
Figure 5. Global land surface water distribution (RADI).
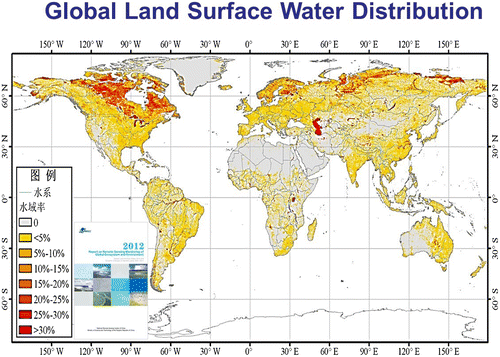
Figure 6. To detect the initial conditions of the atmosphere, climate and air quality we need three components: ground-based observations, satellite observations, and models.

Figure 7. Locations of Miyun (Beijing), Kashi, Sanya, and Kunming Satellite Receiving Stations (RADI).
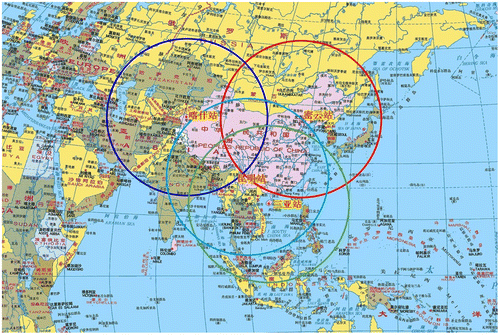
Figure 8. Enviro-HILRAM operational PM2.5 concentration forecasts for China in a downscaling chain (left-right: regional, sub-regional, urban – Shanghai metropolitan area) for 21 January 2018, 22 UTC.
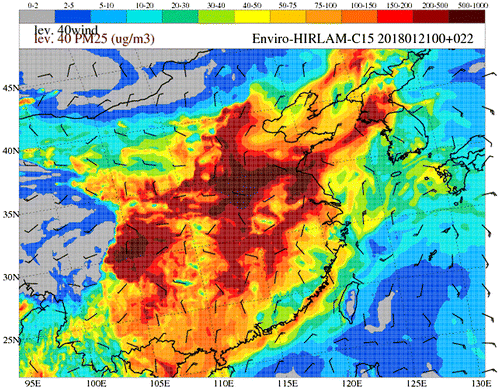
Figure 9. The PEEX-China agenda is contributing to topics introduced in the DBAR Science Plan having a special focus on climate change, urbanization, and research infrastructures providing big data.
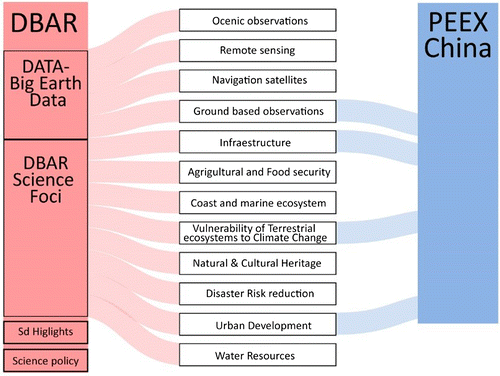
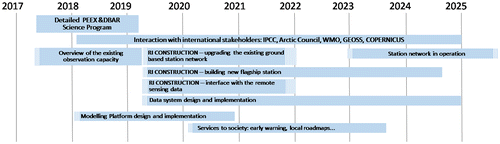
Figure 10. The tentative time frames for implementation the PEEX B&R agenda.
Data availability statement
Data sharing is not applicable to this article as no new data were created or analysed in this study.