Figures & data
Figure 1. Modeling at the energy-water nexus (adapted from Vallario (Citation2017)).
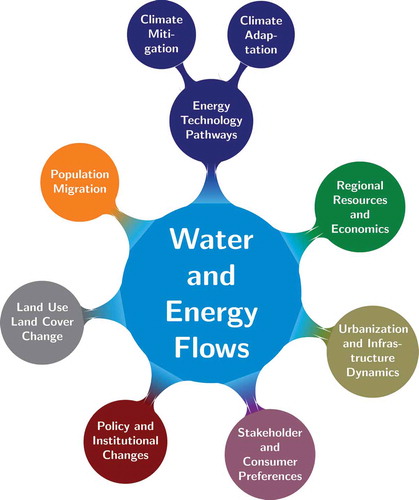
Figure 2. Notional Summary of Spatial and Temporal Scales for Various Analyses of Energy-Water Nexus Issues. Orange boxes represent the energy sector; blue boxes represent the water sector.
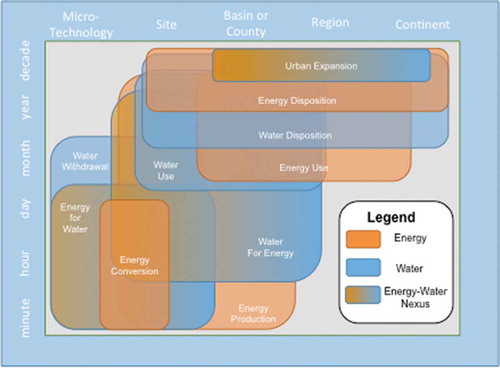
Figure 3. Circos diagram showing categories related by analytical method. Thickness of connecting lines is based on the number of common analytical methods used by each category pair.
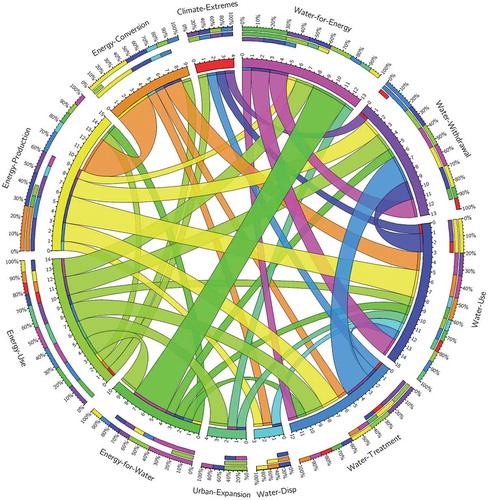
Figure 4. Solar power regression ensemble workflow (adapted from Hossain, Oo, and Ali (Citation2012)).
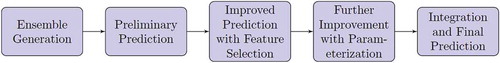
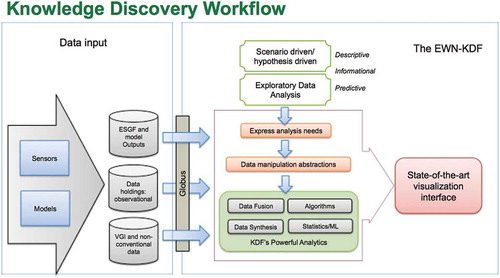
Figure 5. Example Energy-Water Nexus Knowledge Discovery Framework Workflow. Source: Bhaduri et al. (Citation2018).