Figures & data
Figure 1. Simplified geological map of Geza arc (revised after Yunnan geological survey) (a) Tectonic map of Geza island arc, (b) Distribution diagram of magmatic rocks and mineral resources.
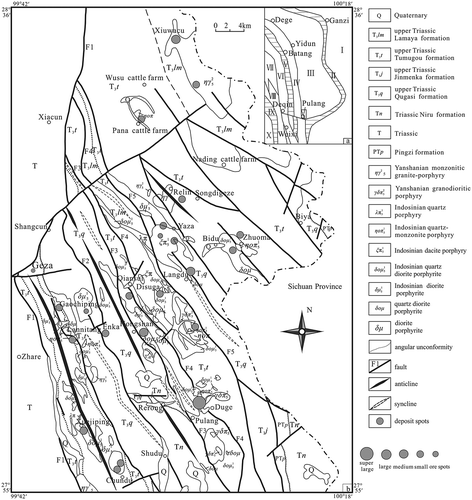
Table 1. Porphyry geochemical data statistics in the Geza arc belt.
Figure 2. Fiducial confidence ellipse scatter plots of Pulang porphyry being included in the range of global adakite In the figure, the red dots represent the global adakite data; blue dots represent Pupang data; red ellipse represents the distribution of glo.
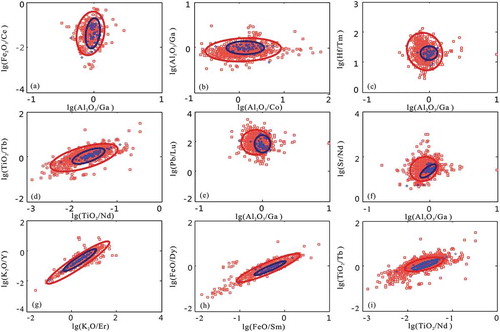
Figure 3. Data distribution correlation graph of Pulang porphyry and the global adakite In the figure, the red dots represent the global adakite data; blue dots represent Pupang data; red ellipse represents the distribution of global adakite data; bule ellips.
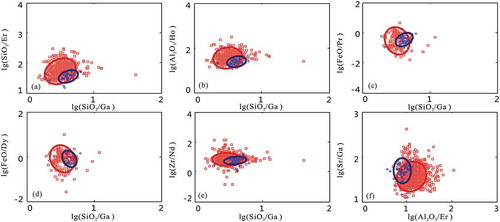
Figure 4. Fiducial confidence ellipse scatter plots of metallogenic element Cu in Pulang porphyry copper deposit In the figure, the red dots represent the global adakite data; blue dots represent Pupang data; red ellipse represents the distribution of global a.
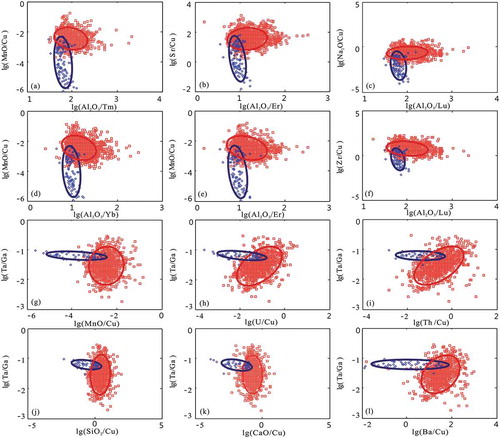
Figure 5. Fiducial confidence ellipse scatter plots of metallogenic element Mo in Pulang porphyry copper deposit.
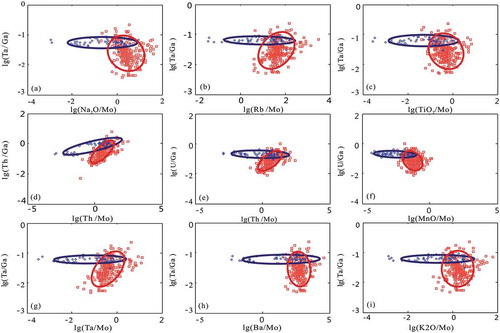
Figure 6. Fiducial confidence ellipse scatter plots of metallogenic element Zn in Pulang porphyry copper deposit In the figure, the red dots represent the global adakite data; blue dots represent Pupang data; red ellipse represents the distribution of global a.
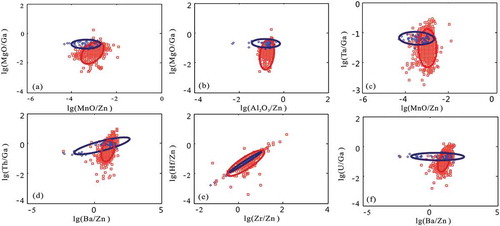
Figure 7. Primitive mantle normalized spider diagram of trace element of Geza porphyry.
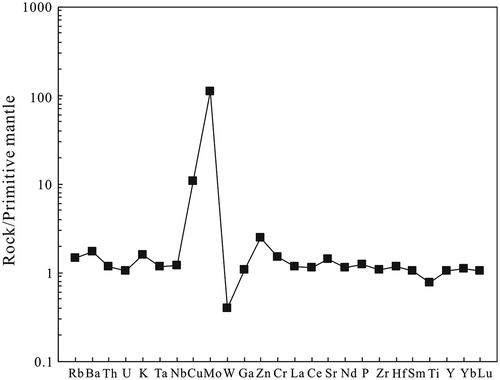
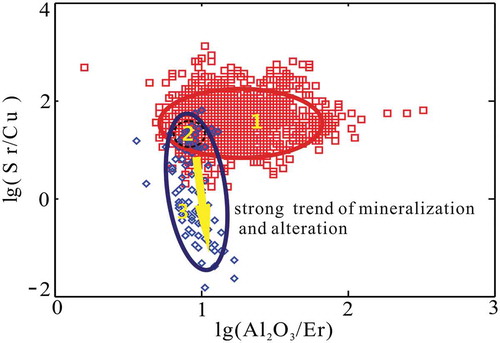
Figure 8. Example of fiducial confidence ellipse scatter plot of Sr/Cu-Al2O3/Er of Pulang porphyry and the global adakite In the figure, the red dots represent the global adakite data; blue dots represent Pupang data; red ellipse represents the distribution o.