Figures & data
Figure 1. Location of South Asia with its elevation profiling – A 30 m spatial resolution Shuttle Radar Topographic Mission, Digital Elevation Model Data was used to prepared elevation profiles.
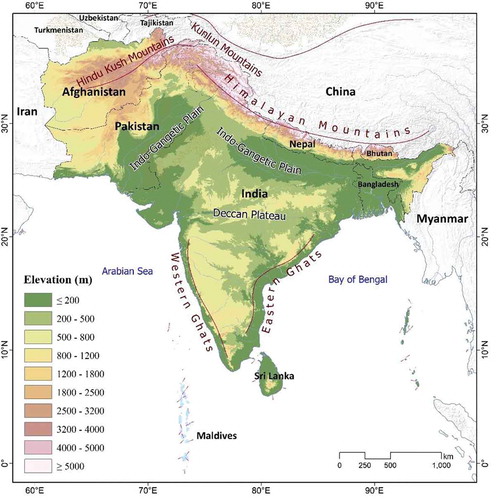
Figure 2. Flowchart of data to knowledge database construction.
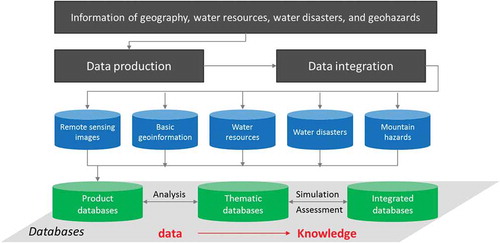
Table 1. Information of hydrological stations used in the validation.
Figure 3. Comparison between the estimated runoff depth by SCS model and the observations from hydrological stations.
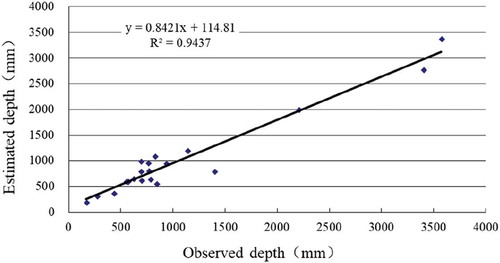
Table 2. Indicators for the flood and drought risk assessment.
Figure 4. Flowchart of geohazard risk assessment.
Table 3. Indicators for the risk assessment of landslide and debris flow.
Figure 5. Annual average air temperature condition in South Asia. (a) Annual average air temperature; (b) annual average air temperature in January; (c) annual average air temperature in July.
(Source: Worldclim v 1.4, http://www.worldclim.org/current).
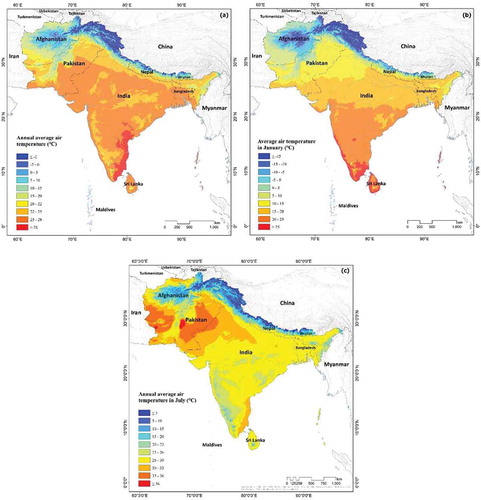
Figure 6. Annual average precipitation (a) and drought degree (b) in South Asia during the last 30 years.
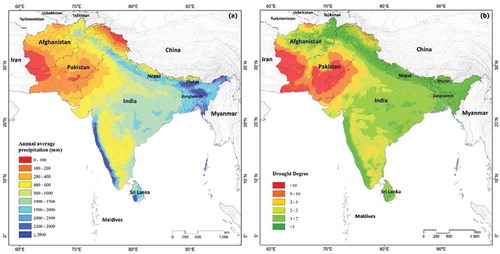
Figure 7. Total precipitation of (a) dry season (March–May) and (b) monsoon season (June–August) acquired from TRMM precipitation product in 2008 (Li, Zhao, & Deng, Citation2015).
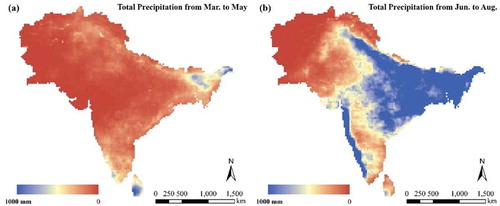
Figure 8. Land cover types in South Asia in 2008.
Source: MODIS 250 m land cover product MCD12Q1.
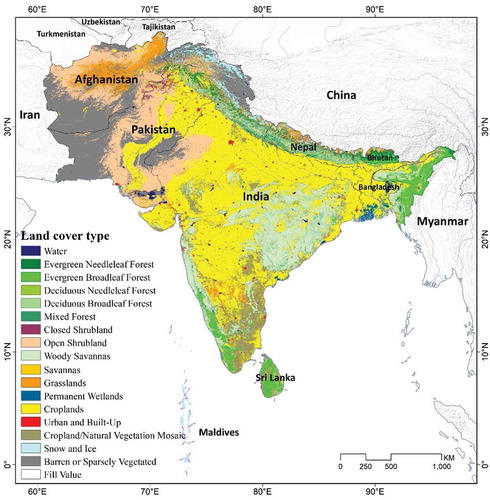
Figure 9. The annual average runoff depth in South Asia.
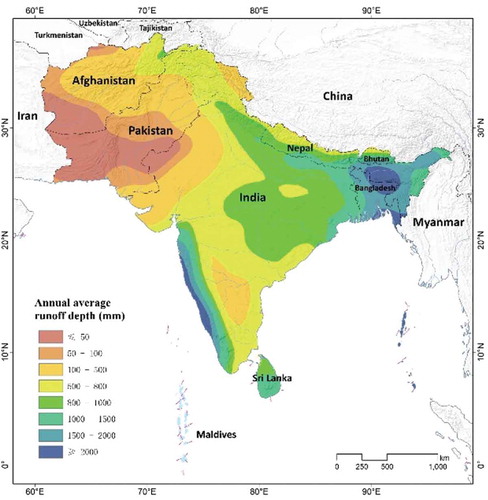
Figure 10. Spatial distribution of landslides (a) and debris flows (b).
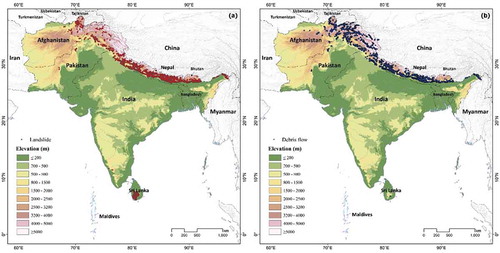
Figure 11. Topographically distribution of landslides along the central Himalayas (Zhang et al., Citation2016). Note: The yellow bars represent the number of landslides.
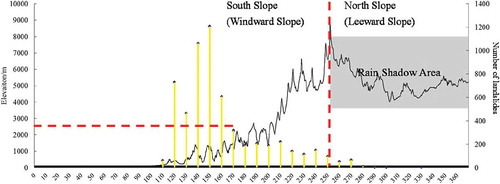
Figure 12. (a) Water resource stress map and (b) concentration index map of the South Asia.
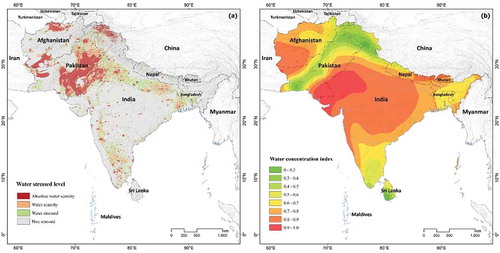
Table 4. Country level water use intensity in the South Asia.
Table 5. Water resources dependency ratio in the South Asia.
Figure 13. Scatter plot between the estimated dependency ratio and the values provided by FAO.
Figure 14. Intensity map of (a) water erosion and (b) wind erosion in the South Asia.
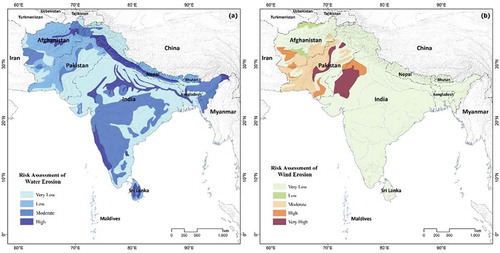
Figure 15. Drought risk assessment in the South Asia.
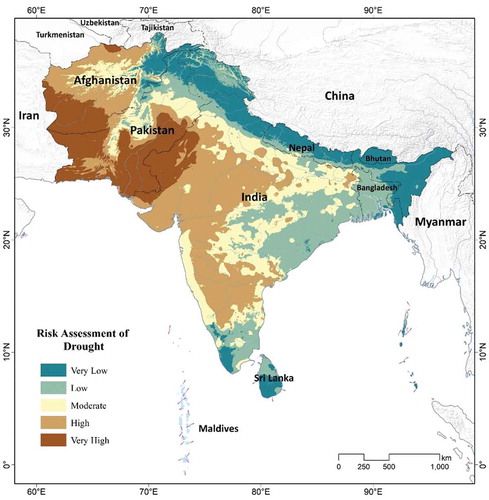
Figure 16. Flood risk assessment in South Asia.
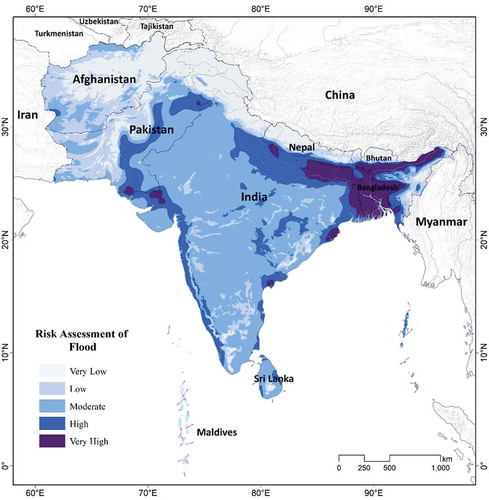
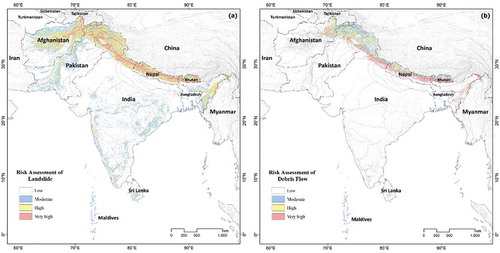
Figure 17. Geohazard risk assessment in the South Asia: (a) Landslide and (b) debris flow.